is hardware-independent
needs no cloud. All data is being processed locally on your PC.
empowers you with maximum analysis capabilities also beyond eye tracking
Analyzing a Dynamic Eye Tracking Experiment
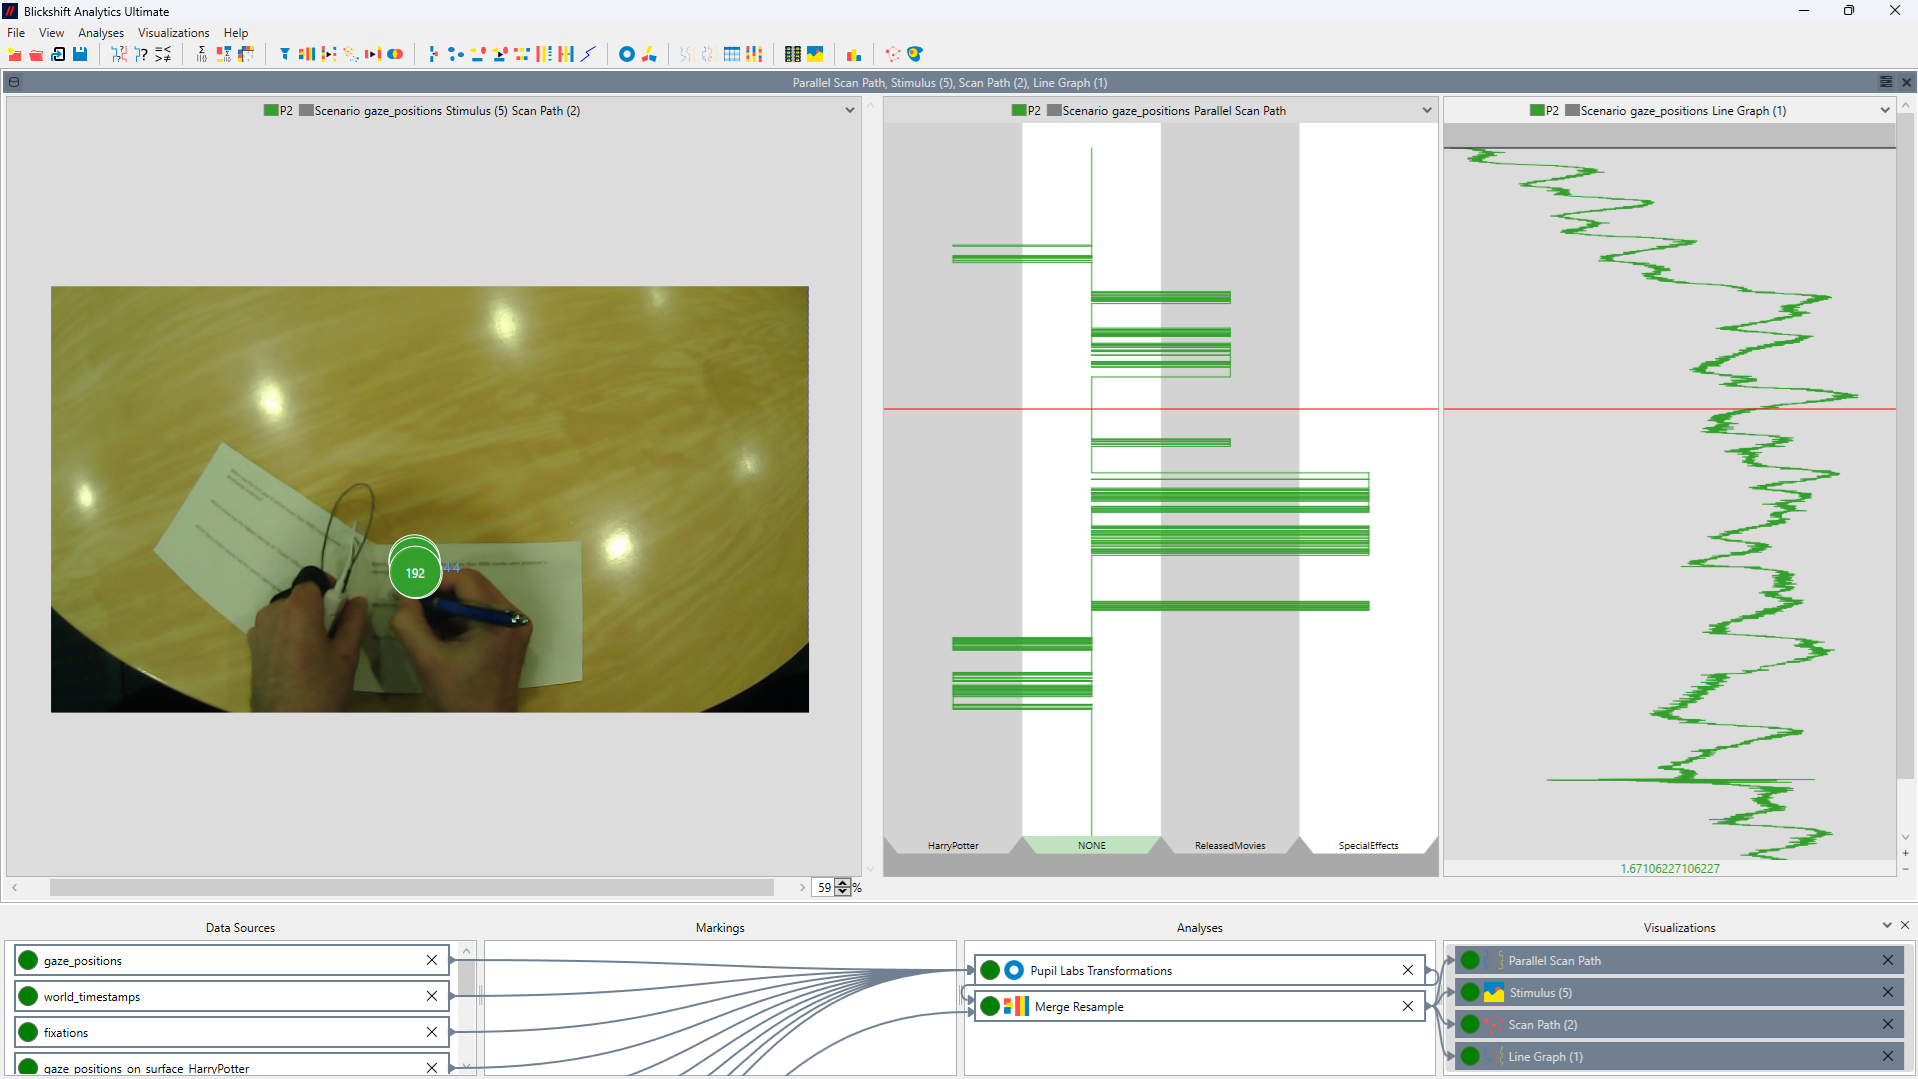
Several factors must be considered when analyzing a dynamic eye-tracking experiment in a software application, including data collection methods, gaze analysis, real-time tracking performance, and user behaviour interpretation.
Key Metrics in Dynamic Eye Tracking Analysis:
- Fixation duration (time spent looking at an object)
- Saccades (rapid eye movements)
- Pupil dilation (response to stimuli)
- Gaze heatmaps (where users focus the most)
- and many more
Data Visualization & Analysis in Blickshift for dynamic eye tracking experiments:
- Heatmaps – Show where users focused the most.
- Gaze Plots – Display eye movement sequences.
- Scan Paths – Reveal how users navigate content.
- AOIs (Areas of Interest) – Define key sections for analysis.
- Fixation Time Comparisons
- Reaction Time Analysis
- Comparing Groups
- and may more.
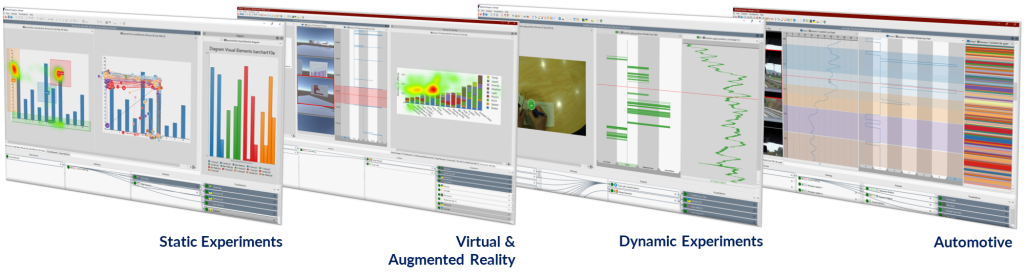
Analyzing classical static desktop eye tracking experiments
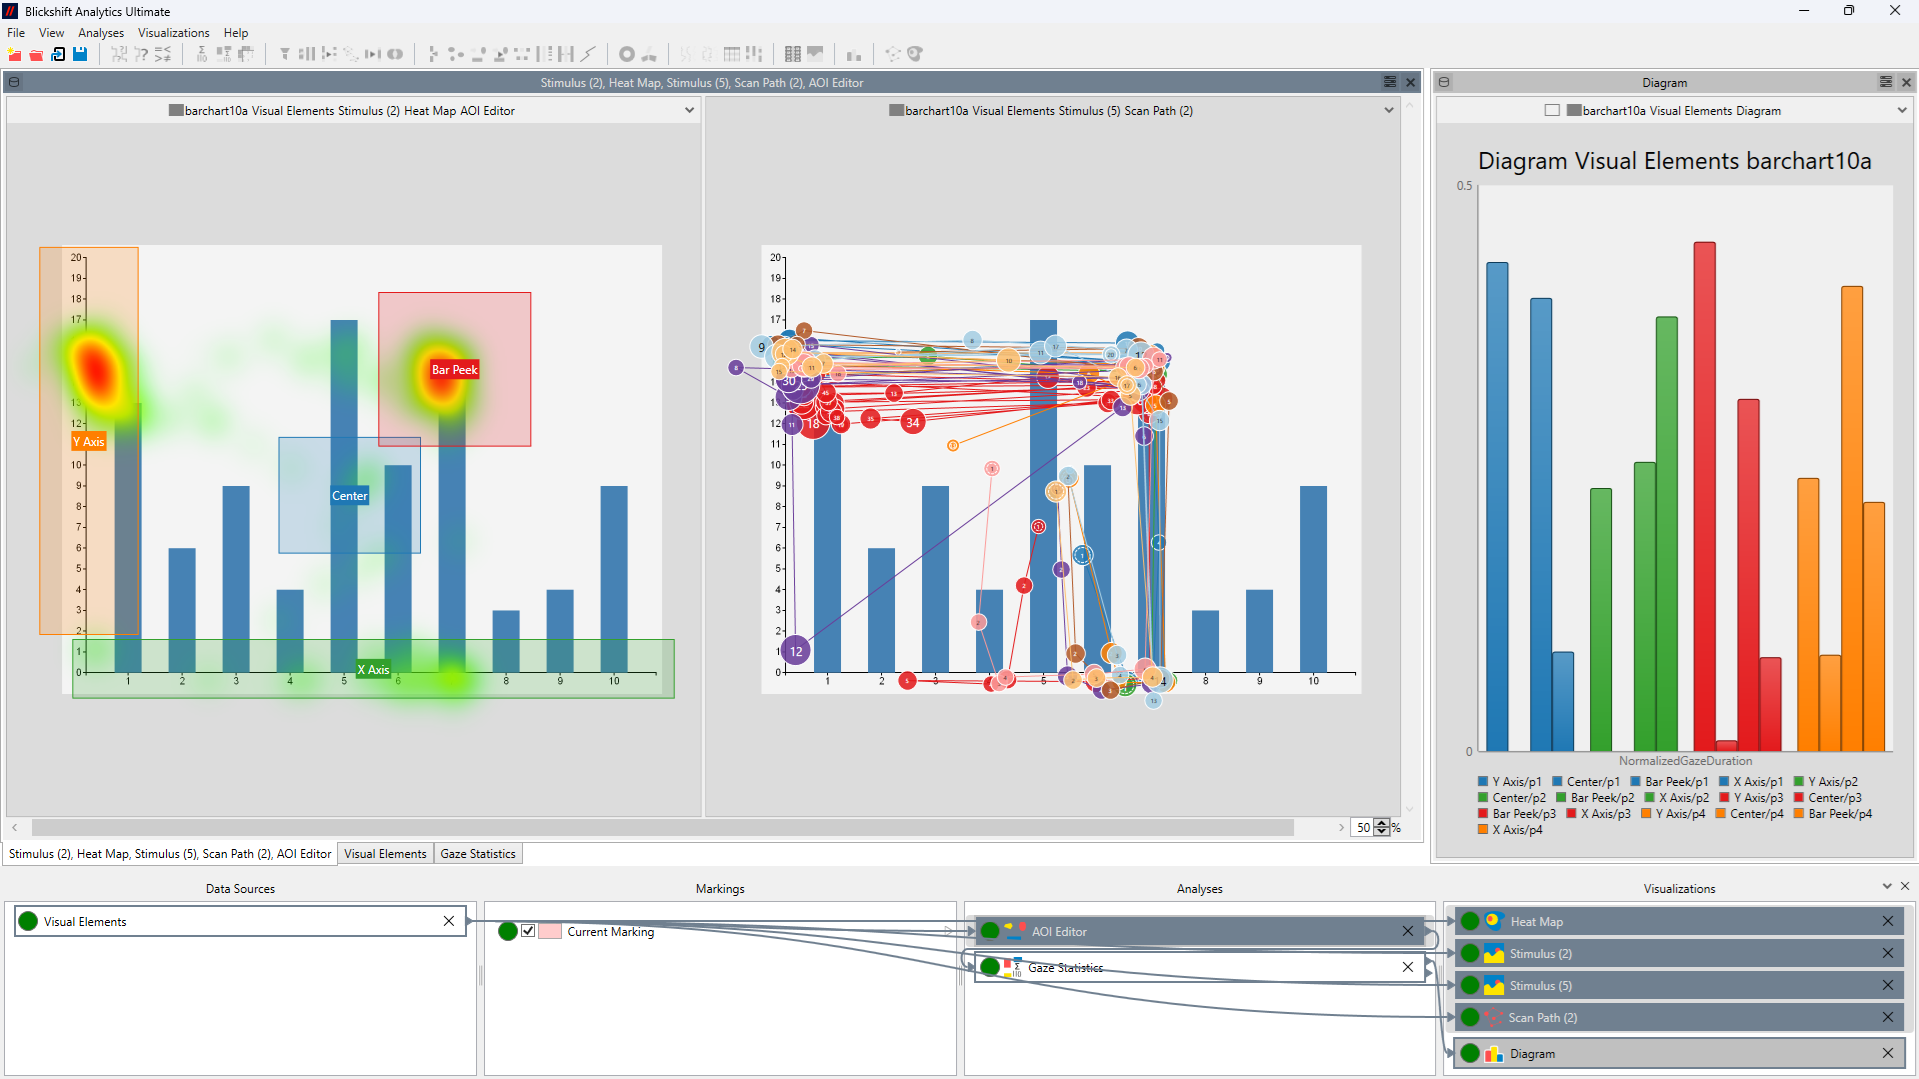
Classical desktop eye tracking analysis is widely used in UI/UX research, cognitive psychology, marketing, and accessibility testing. It involves tracking users’ eye movements while they interact with a desktop screen and analysing their gaze behaviour. Key metrics in desktop eye tracking analysis in Blickshift Analytics are:
- Fixations – Points where the user’s gaze lingers on the screen.
- Fixation Duration – How long the user focuses on an element.
- Saccades – Rapid eye movements between fixation points.
- Gaze Heatmaps – Areas of the screen that receive the most visual attention.
- Scan Paths – The sequence in which users look at different areas.
- Blink Rate – Indicates fatigue or cognitive load.
- Pupil Dilation – Measures emotional or cognitive response.
Data Visualization & Analysis
- Heatmap Analysis
- Gaze Plots & Scan Paths
- Fixation & Saccade Metrics
- AOI (Areas of Interest) Analysis
- Descriptive Statistics
Supports Virtual & Augmented Reality Experiments
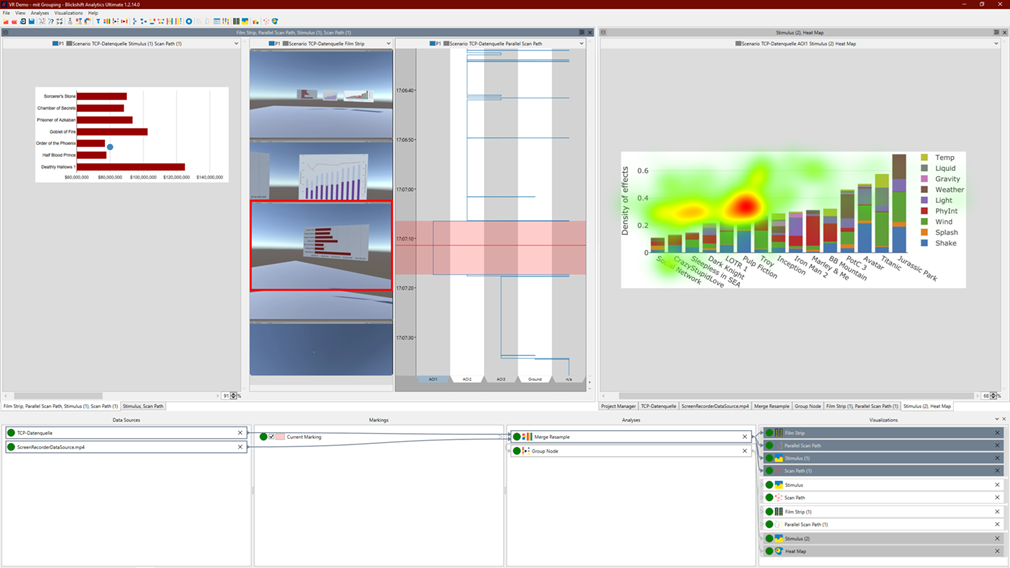
Analyzing eye tracking data in Virtual Reality (VR) introduces unique challenges due to the immersive and interactive nature of the environment. However, it also provides rich, dynamic datasets that can be used for user experience research, interaction design, and cognitive load measurement. Key metrics for AR & VR eye tracking in Blickshift Analytics are:
- Fixation – Points where the user’s eyes remain stable for a short period.
- Saccades – Quick eye movements between fixations.
- Pupil Dilation – Indicates emotional response or cognitive load.
- Blink Rate – Used to measure fatigue or cognitive load.
VR-Specific Metrics:
- Point of Gaze in 3D Space – Unlike 2D screens, gaze coordinates need to be interpreted in 3D VR environments.
- Gaze Duration – How long the user looks at a specific object or area in the virtual world.
- Gaze Focus Areas – Identifying where users spend the most time in immersive environments.
Data Visualization and Analysis
- Gaze Heatmaps
- Gaze Plots & Trajectories
- Foveated Rendering & Performance
- Cognitive Load & Emotional Response
- Analyzing Fixation Patterns
- Comparing Groups
- Statistical Significance
High efficiency in automotive user experiments
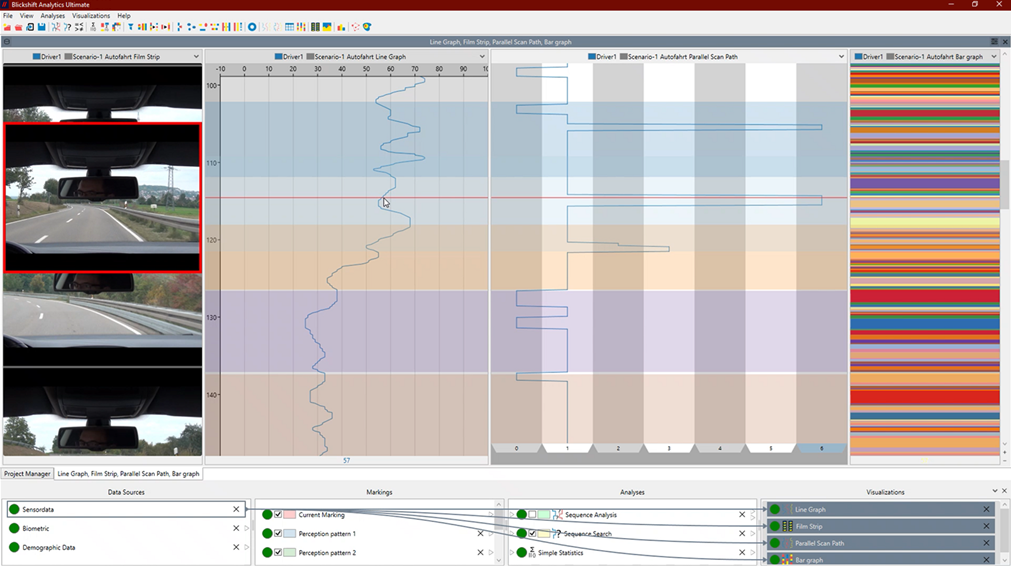
Eye tracking is critical in improving driver safety, vehicle design, in-cabin user experience, and autonomous vehicle interactions in the automotive industry. By analysing eye-tracking data, automotive engineers and researchers can gain insights into driver attention, cognitive load, and interaction with in-vehicle displays. Blickshift Analytics supports key metrics in automotive eye tracking analysis like:
- Gaze Behaviour Metrics
- Contextual Metrics Specific to Driving
- Eye Tracking Data Points
Data Visualization and Analysis
- Heatmaps
- Gaze Plots and Trajectories
- Car information visualization
- Comparing Driving Conditions
- Comparing Different User Groups
- Statistical Significance
Easy import & export
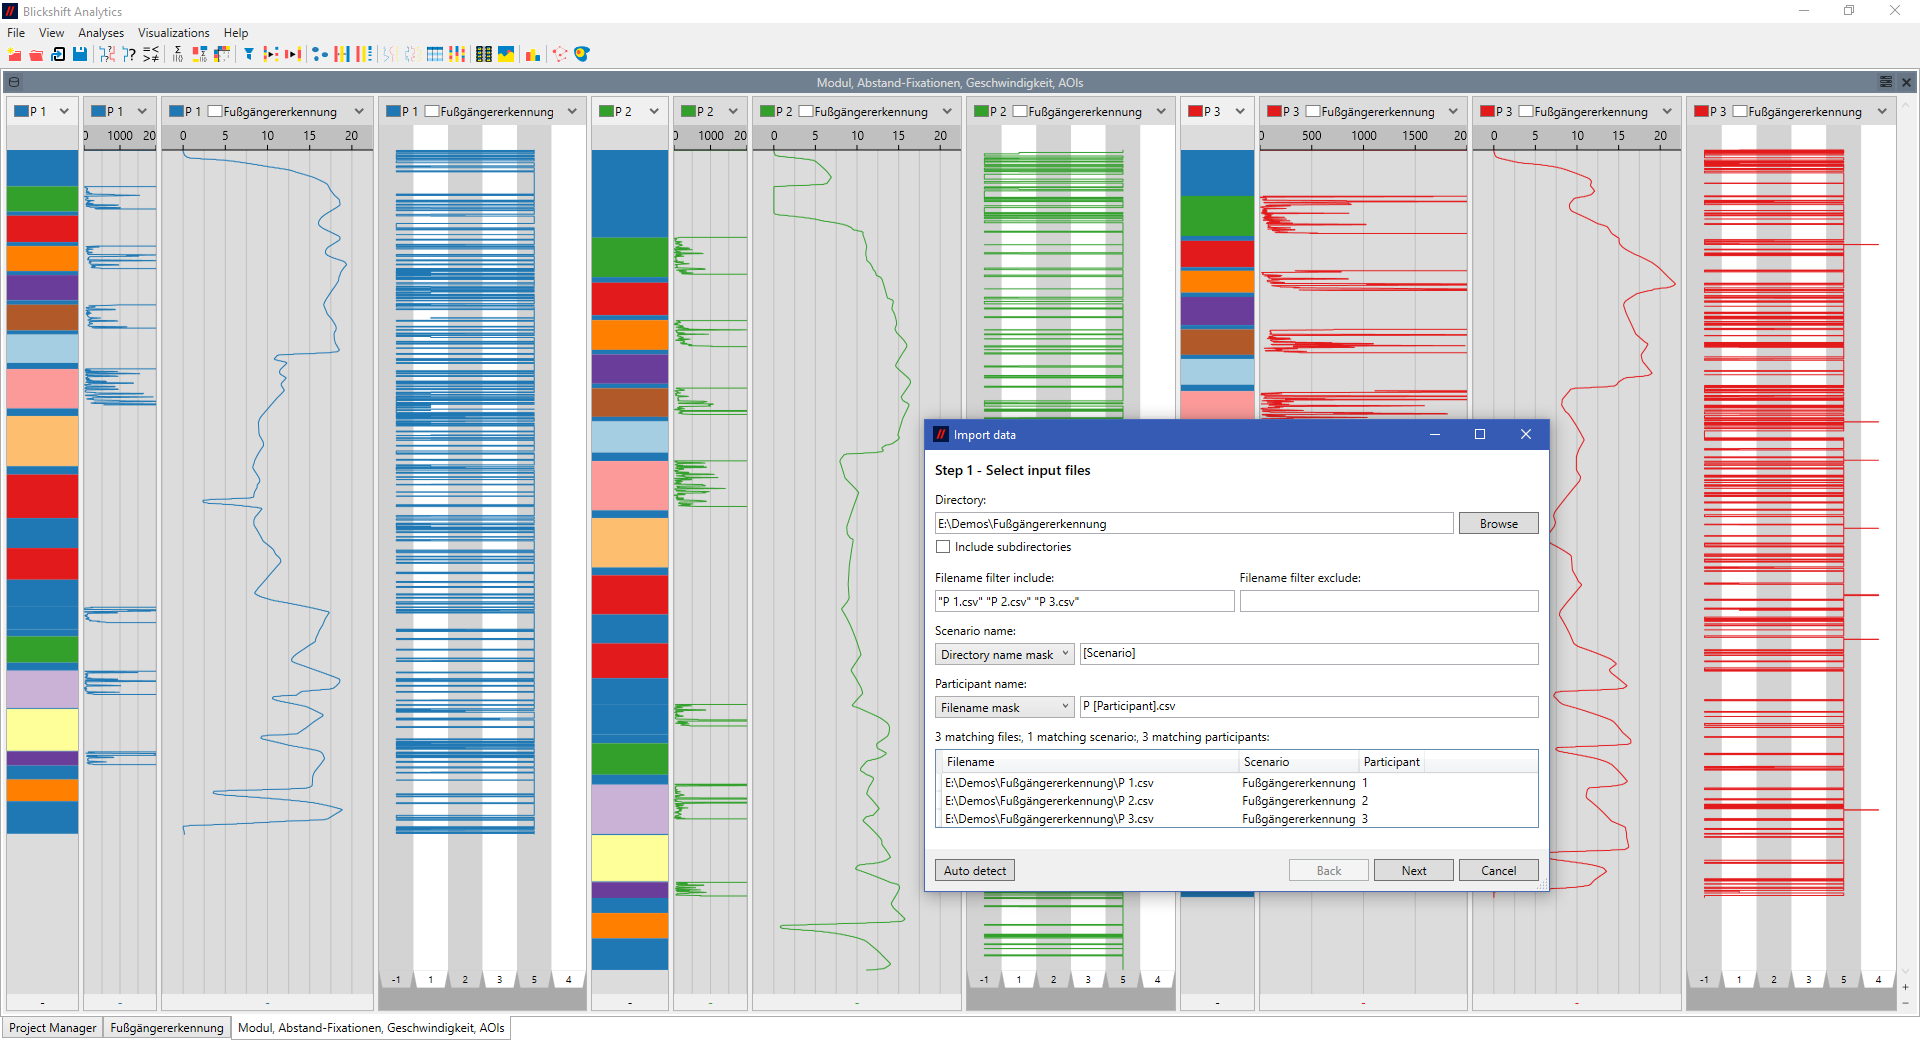
- Easy import: Blickshift Analytics supports importing data from all major eye tracking manufacturers that support exporting to csv files.
- CSV export: Results of analyses, marked areas in the data and other intermediate and final results can be exported to csv files at any time.
- Image export: Export visualizations to images or the clipboard at any time.