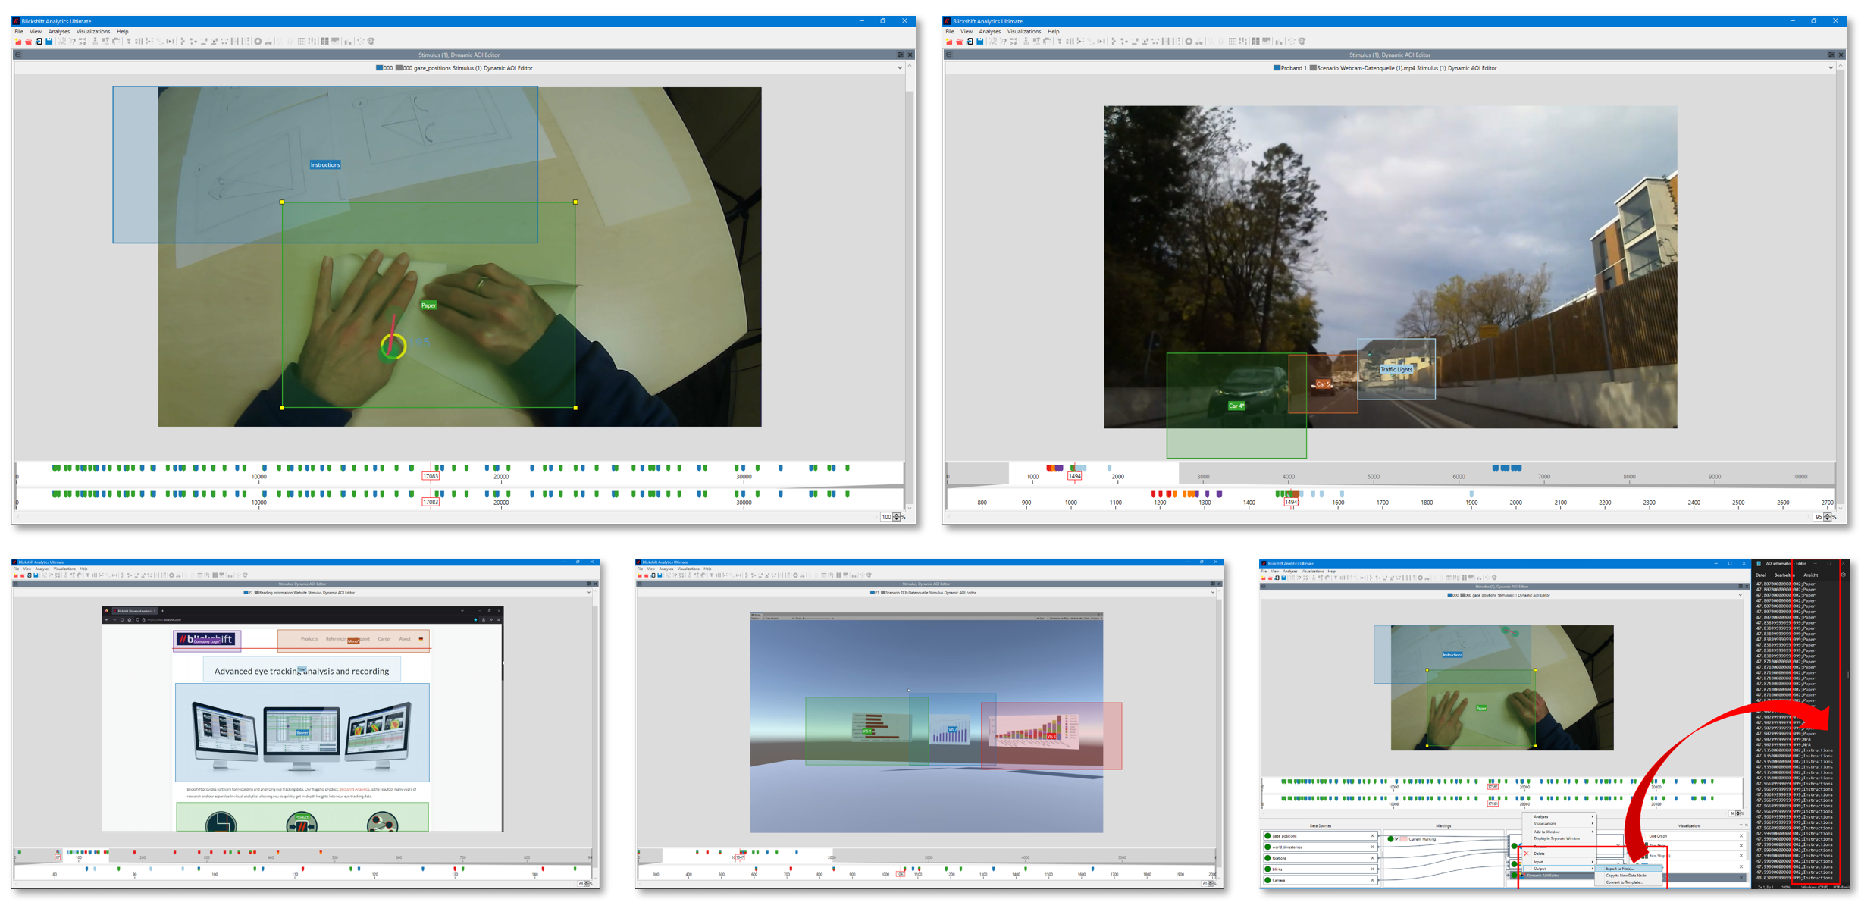
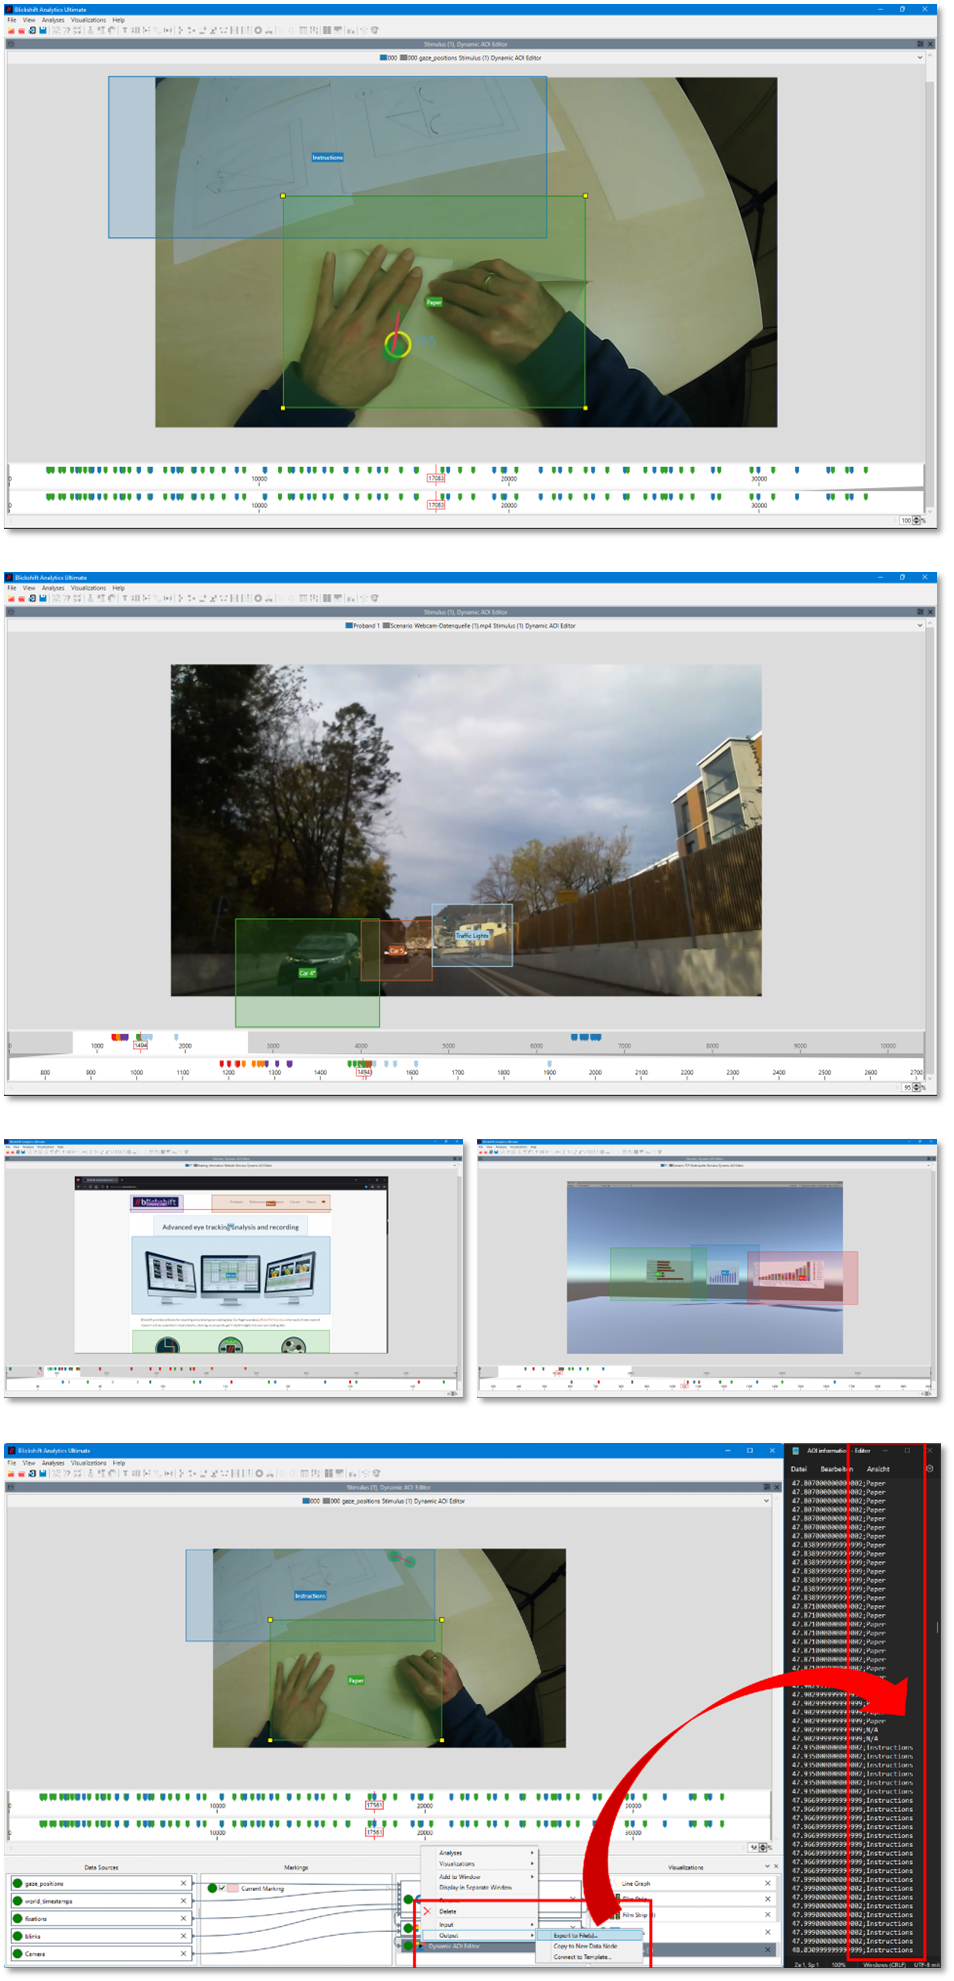
The preparation of eye movement data for analysis sometimes can be quite time-consuming. Especially when eye movements in dynamic scenes are to be examined. An initial step in such analyses is to annotate the stimuli with information about areas of interest. Our upcoming release will include a powerful AOI editor optimized for creating AOIs in dynamic scenes. One easy-to-use interface will give you full control over any created dynamic AOI at any moment of your recorded videos.
You only need to annotate the keyframes of your experiment. The rest of the annotation process is handled by our software by automatically interpolating the AOI trajectories between these keyframes. With this feature, we significantly reduce the time required to analyse eye-tracking data. After annotating your experiment data, you can either continue with the analysis in our software or export the annotated data in standard CSV format for analysis with external tools.
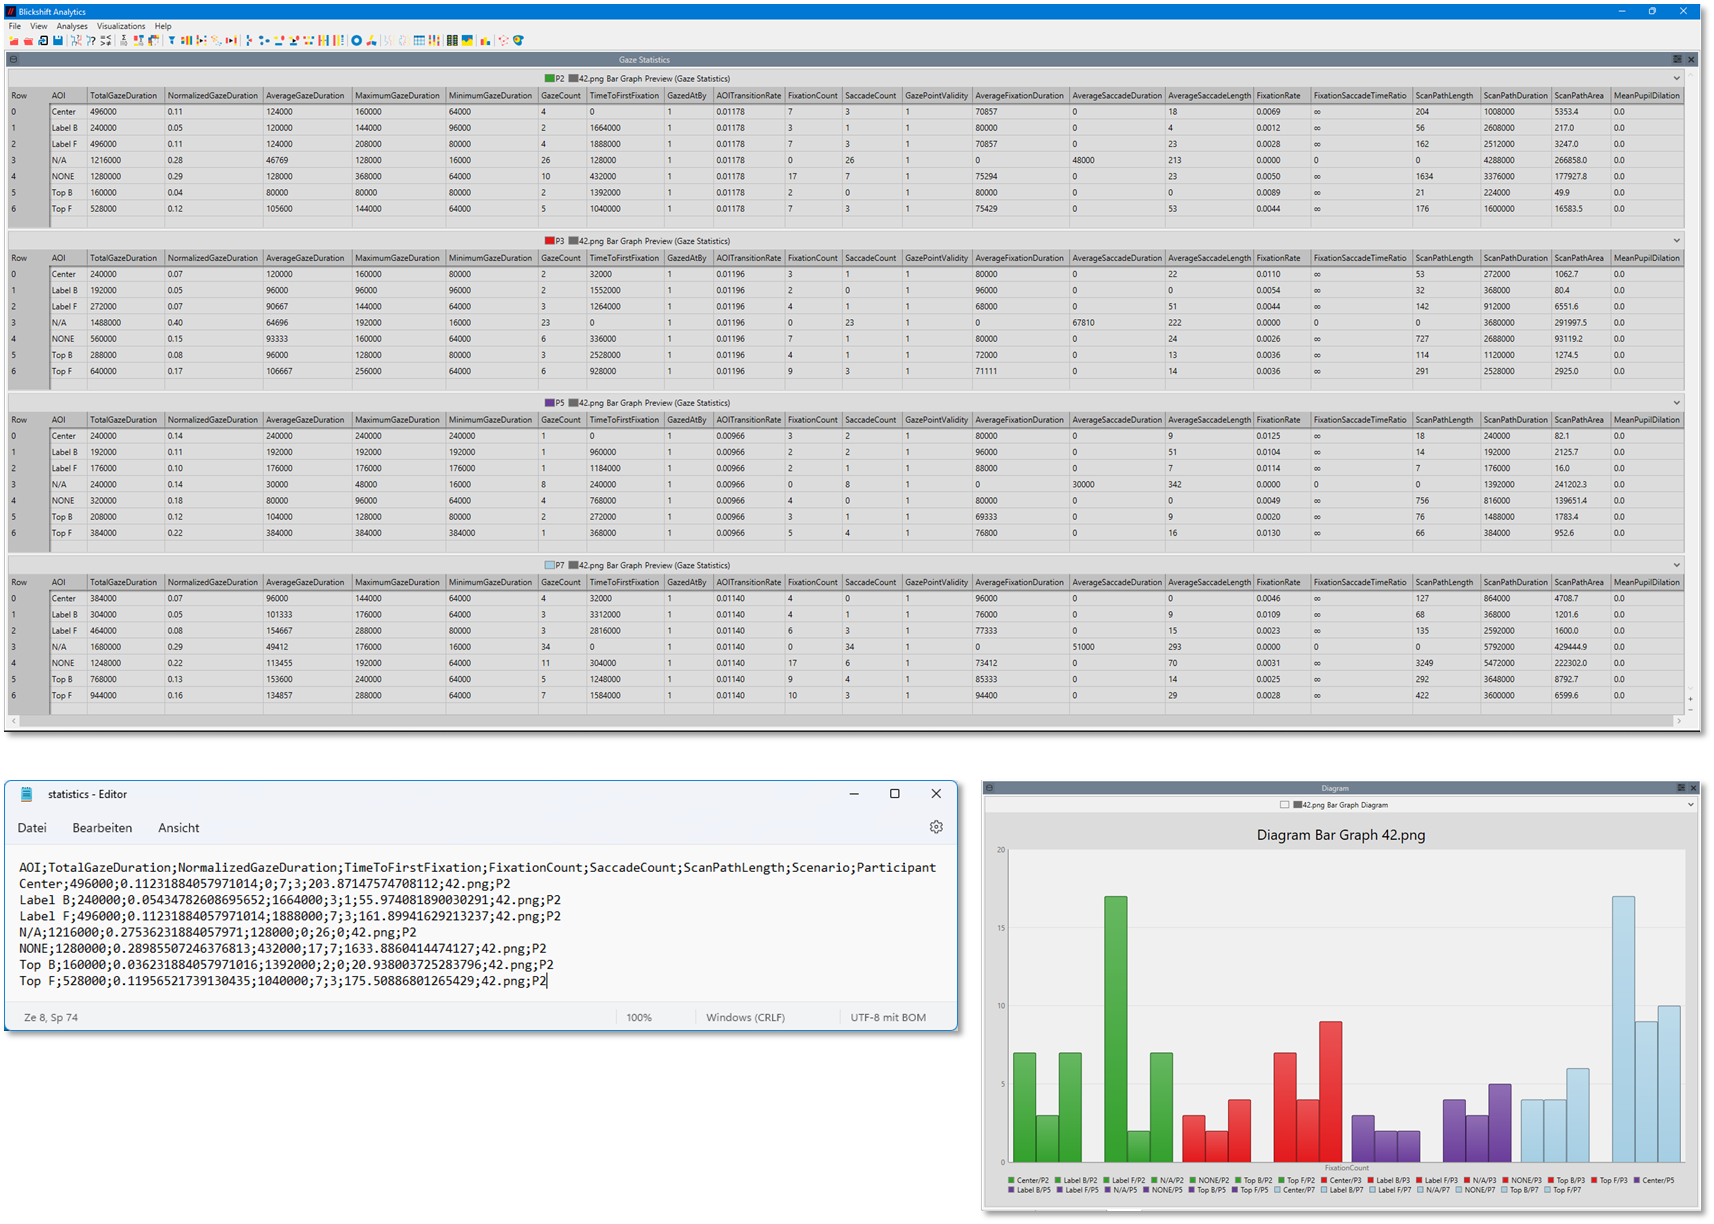
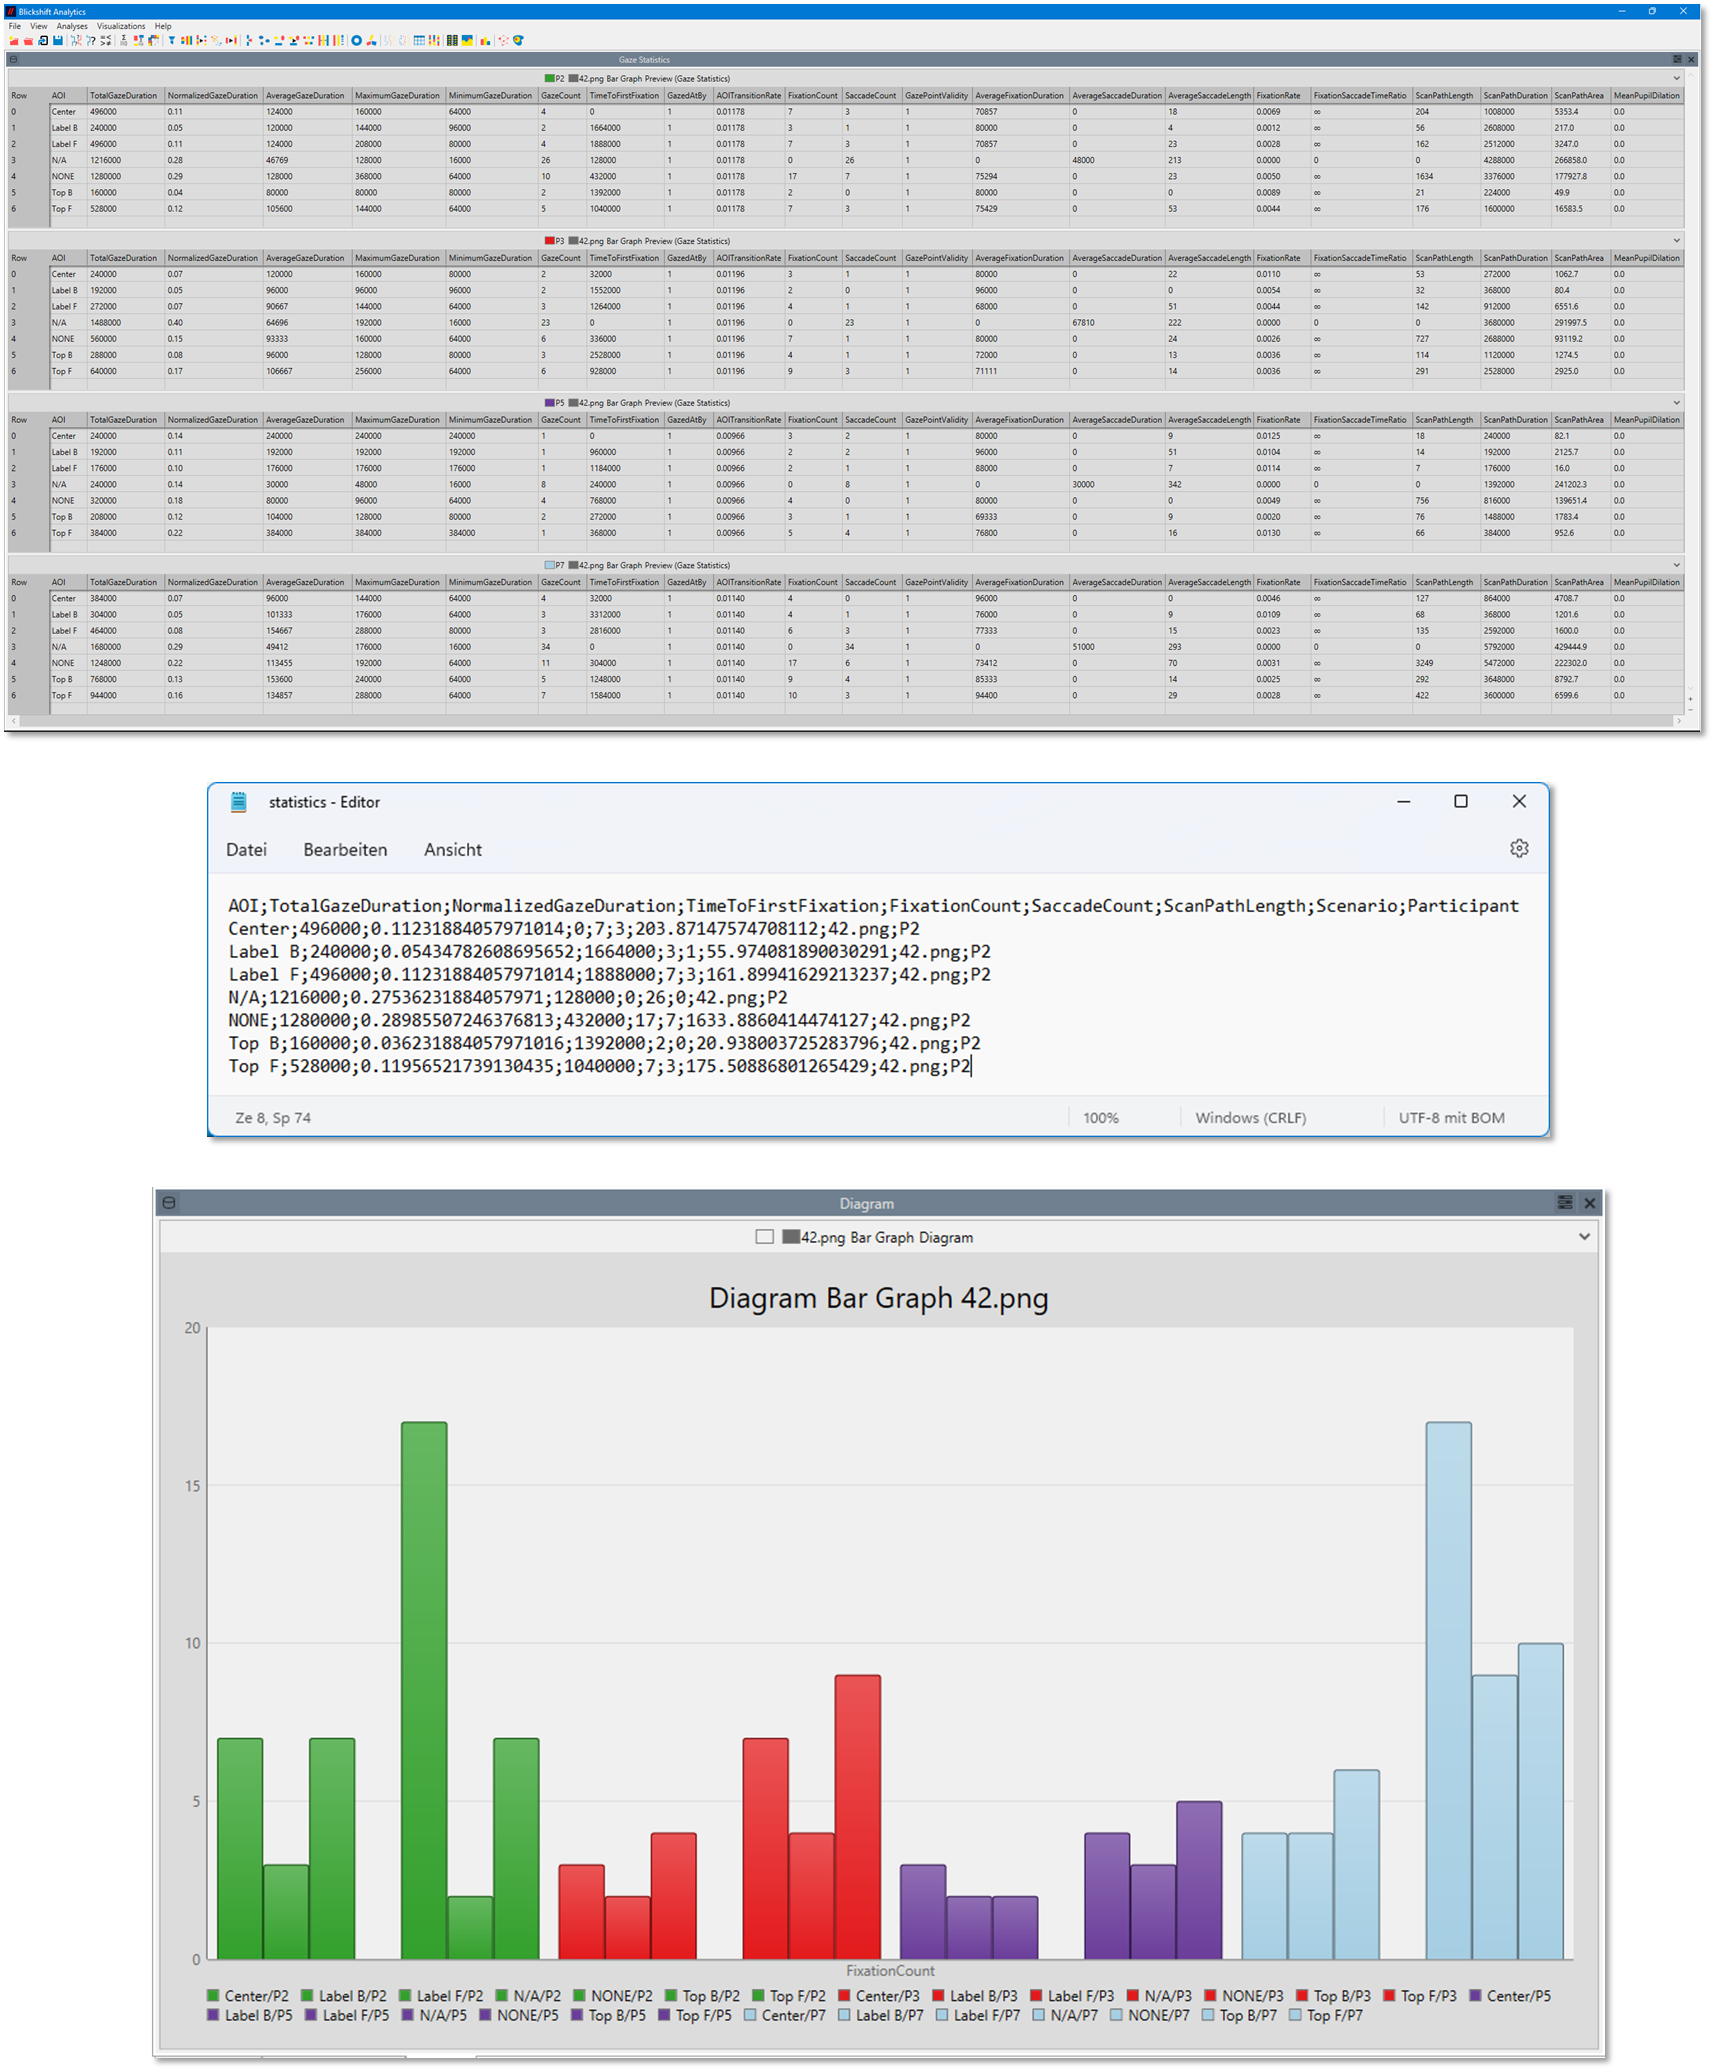
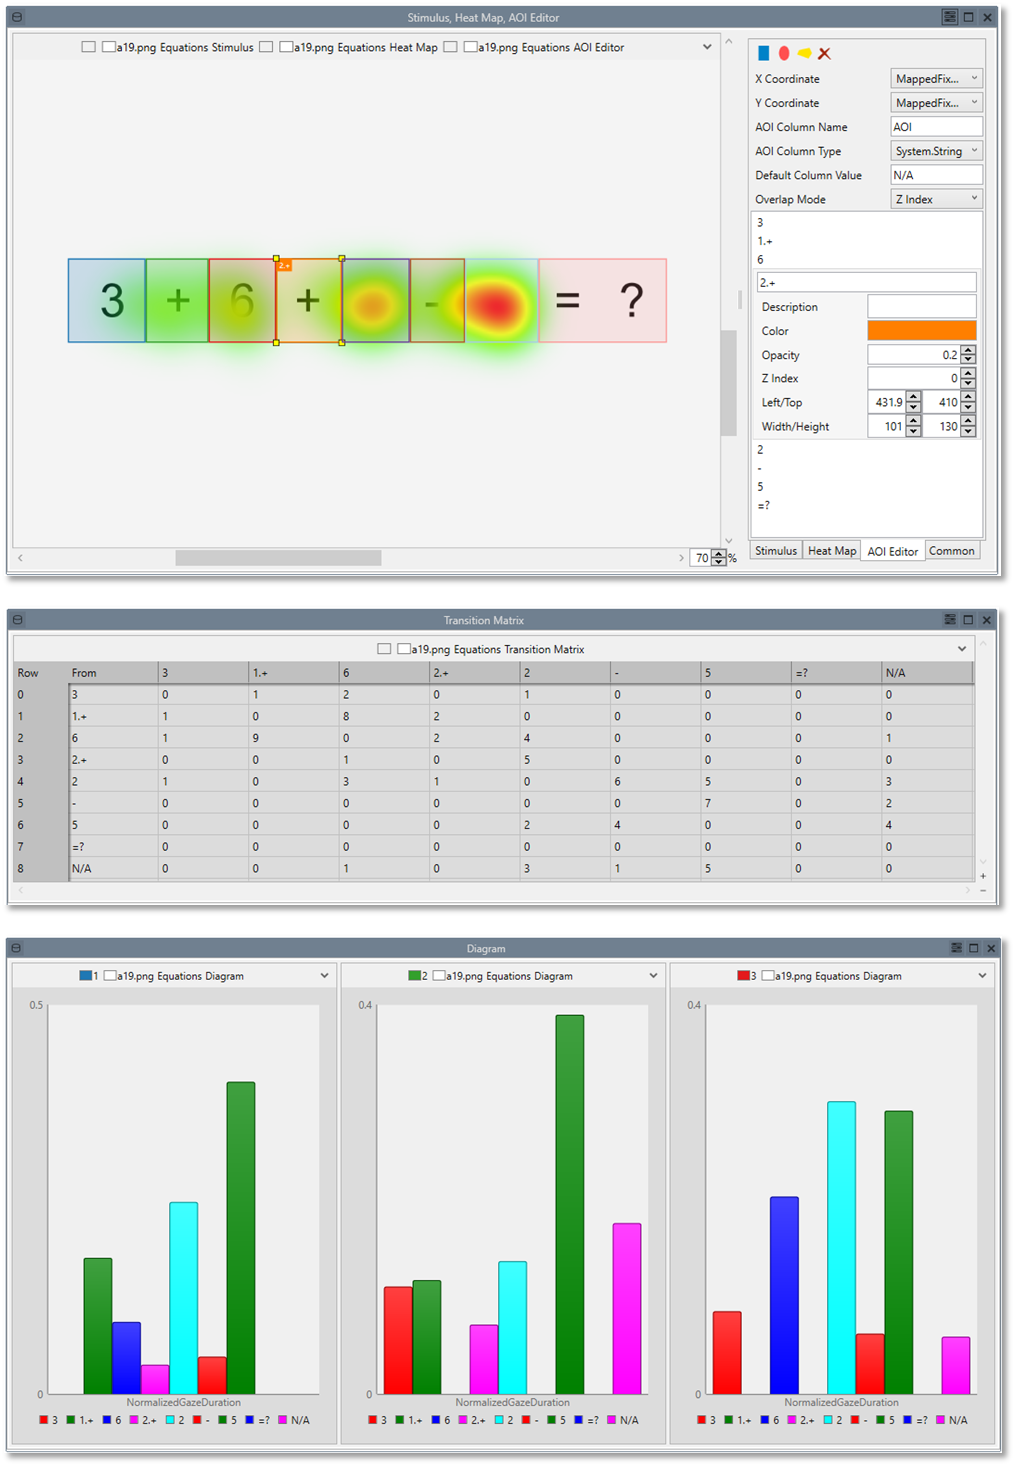
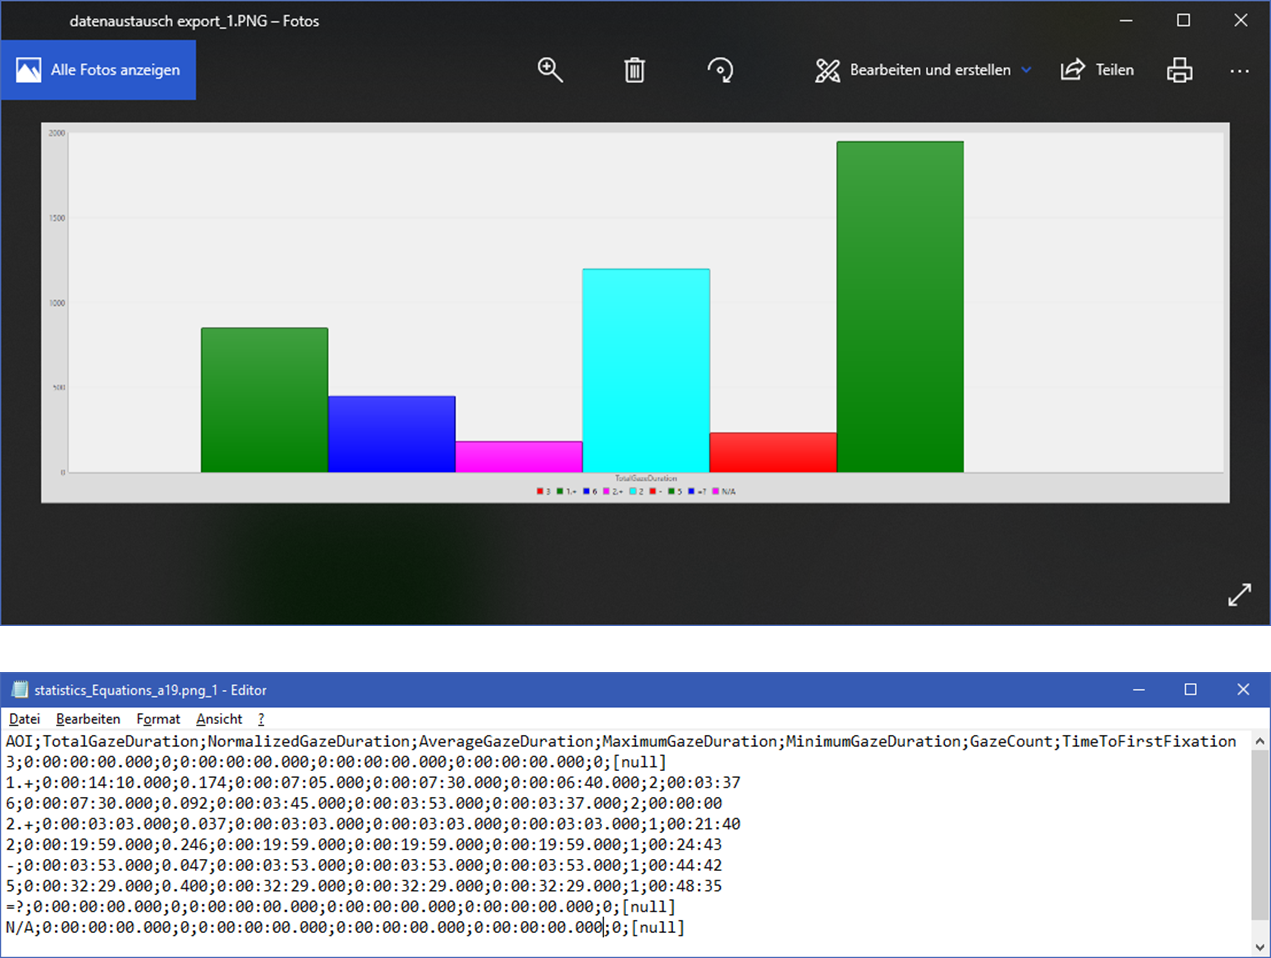
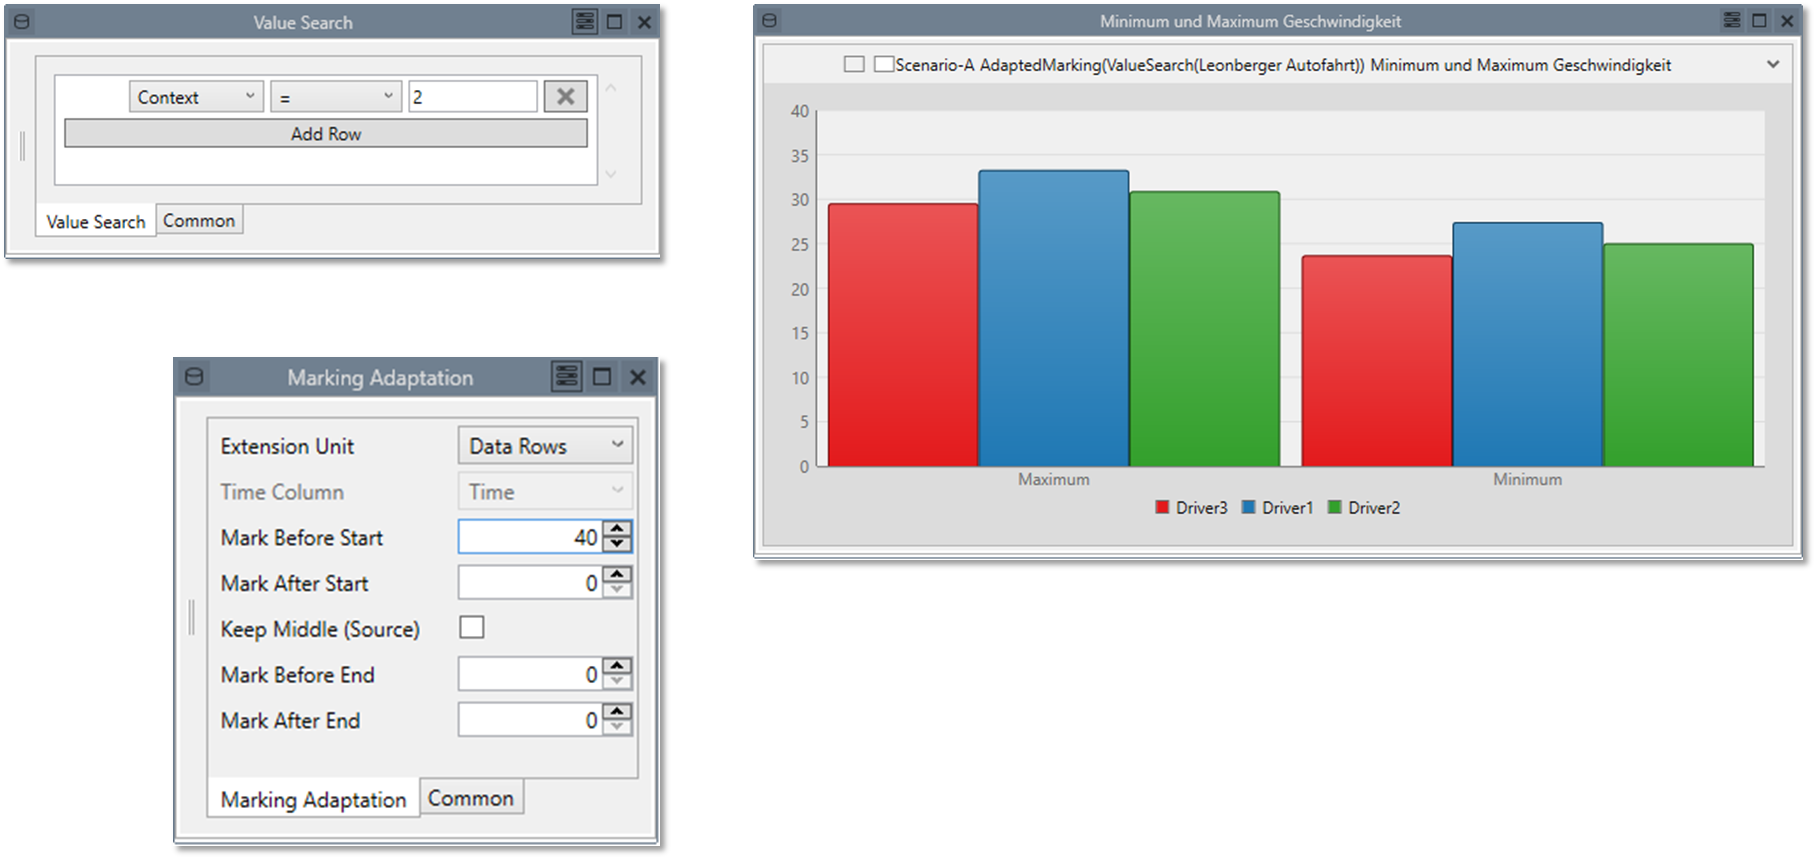
Calculating statistics metrics about eye movements is an essential tool during an eye tracking analysis. We’ve analyzed what metrics most eye tracking researchers are using and have implemented all of them in one single component! In our upcoming release you can now compute up to 21 metrics without any implementation of code just by a mouse-click.
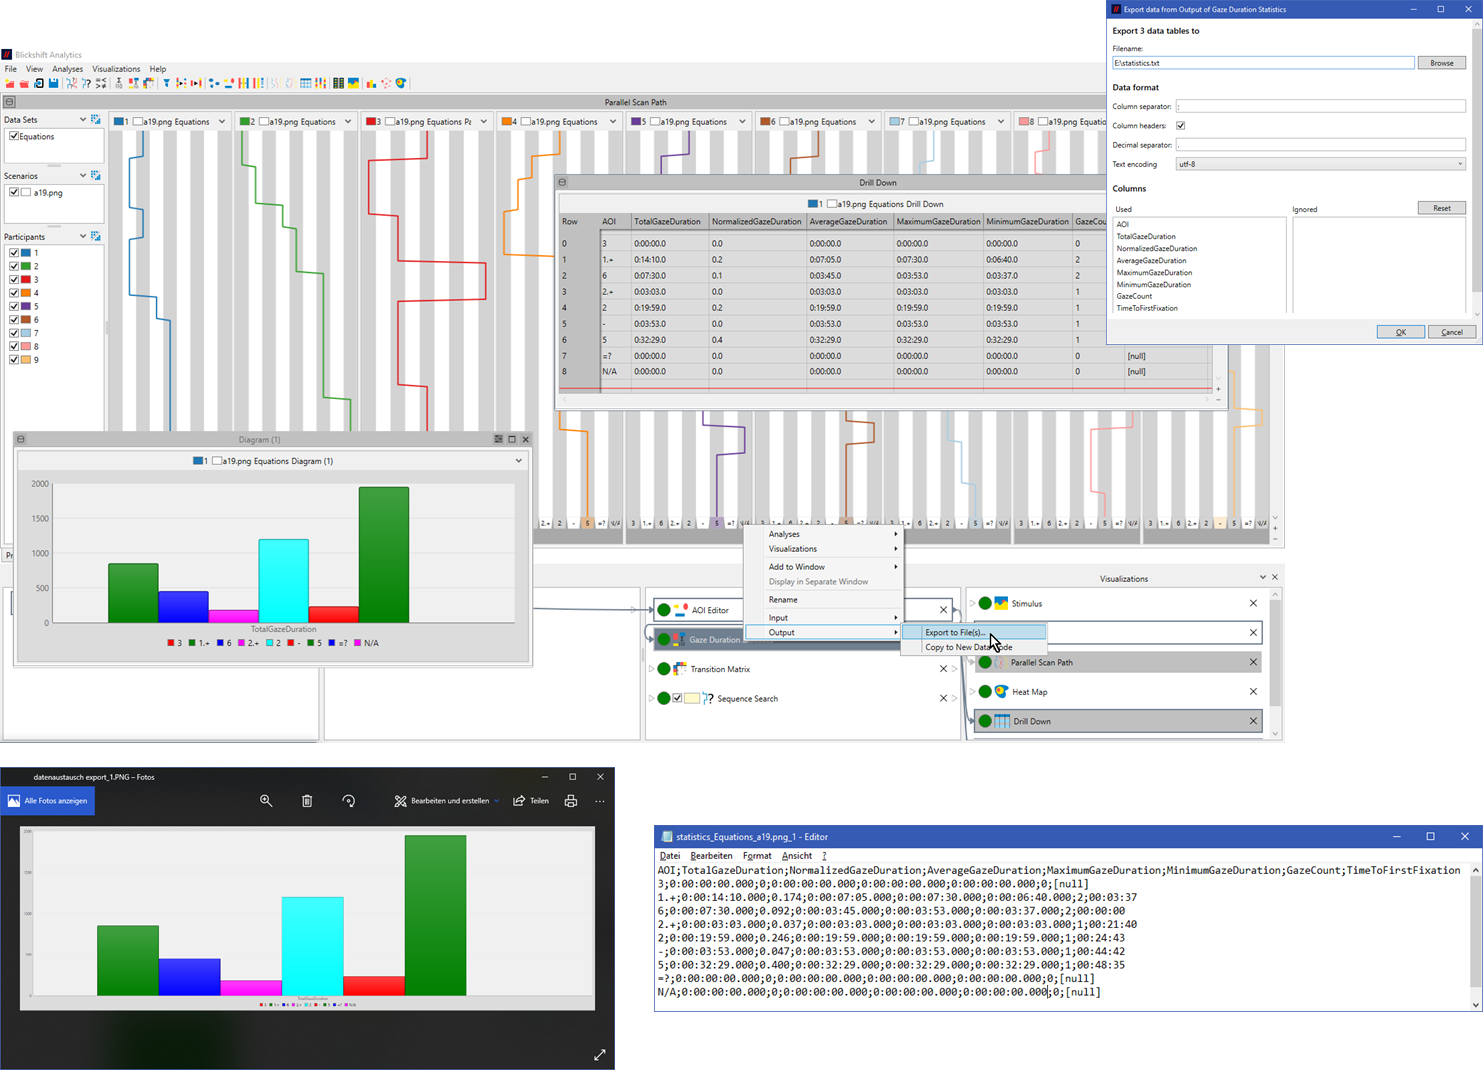
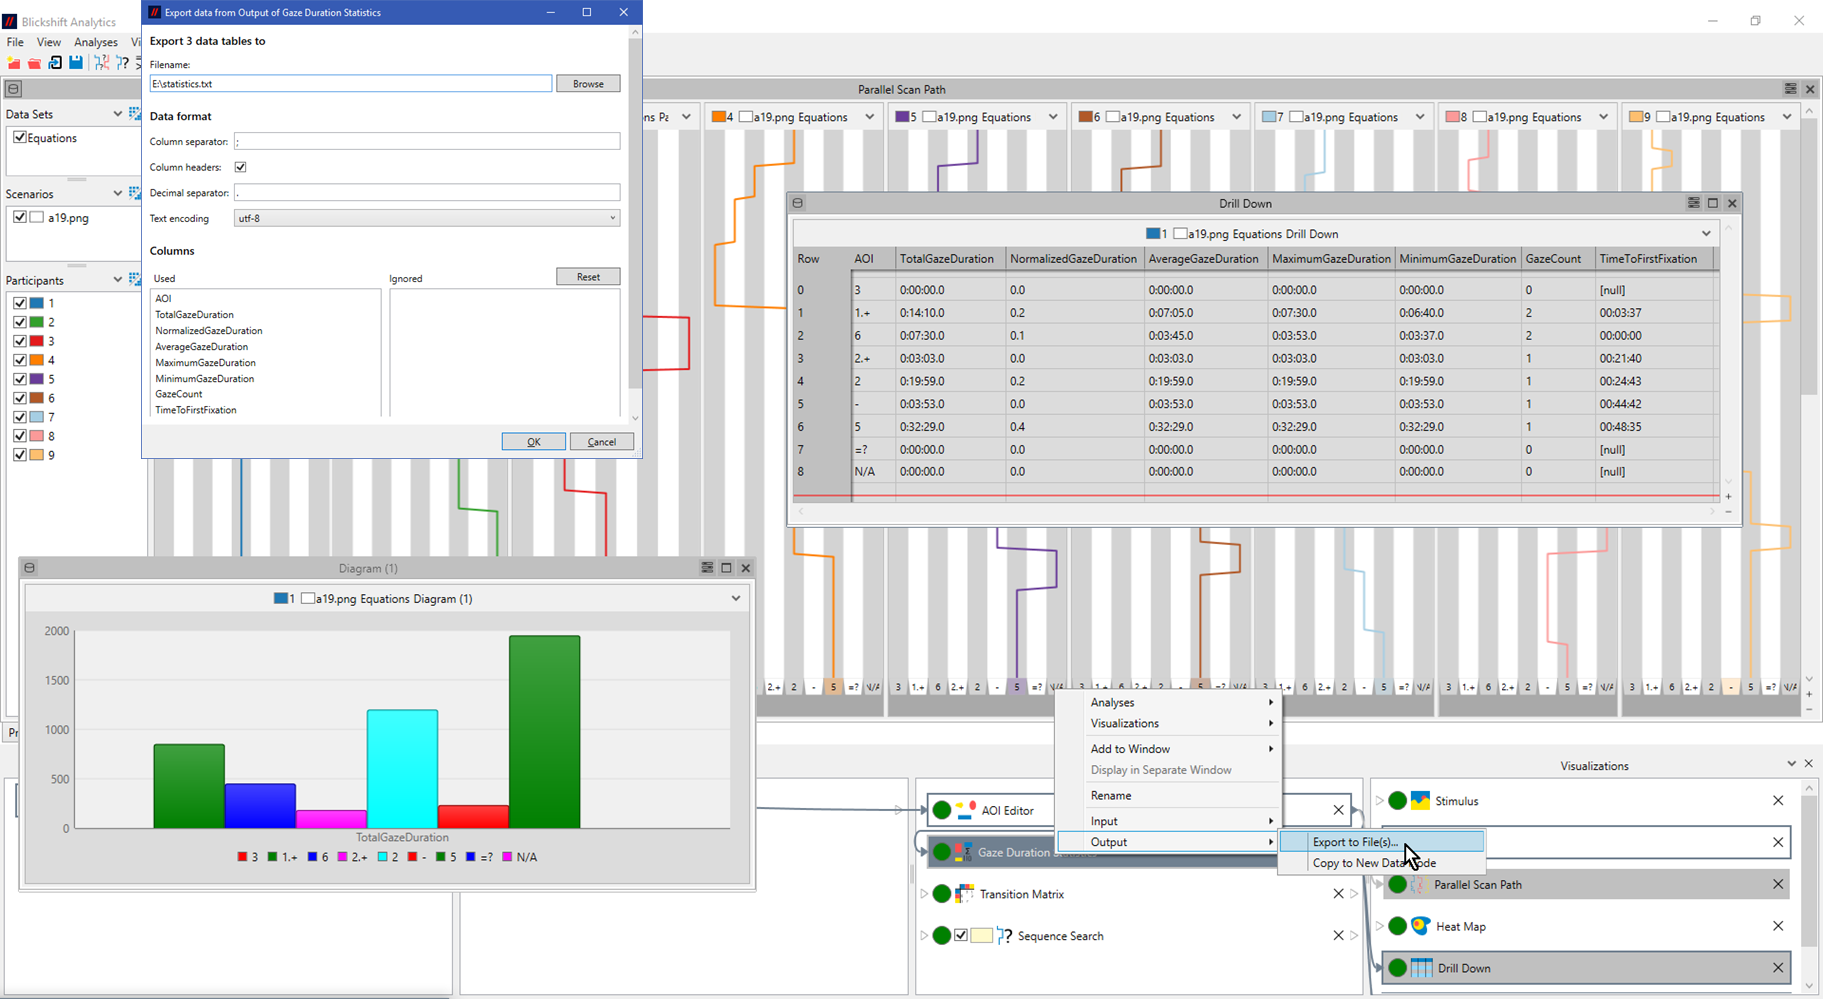
Like computing these metrics is easy, you can simply export all these metrics in standard csv format for a further statistical analysis with the tools you are currently already using. If you want to directly visualize the statistical results this is also possible. The statistic node seemlesly works together with our diagram component. Both components are available in all edition of Blickshift Analytics together with the data exporter.
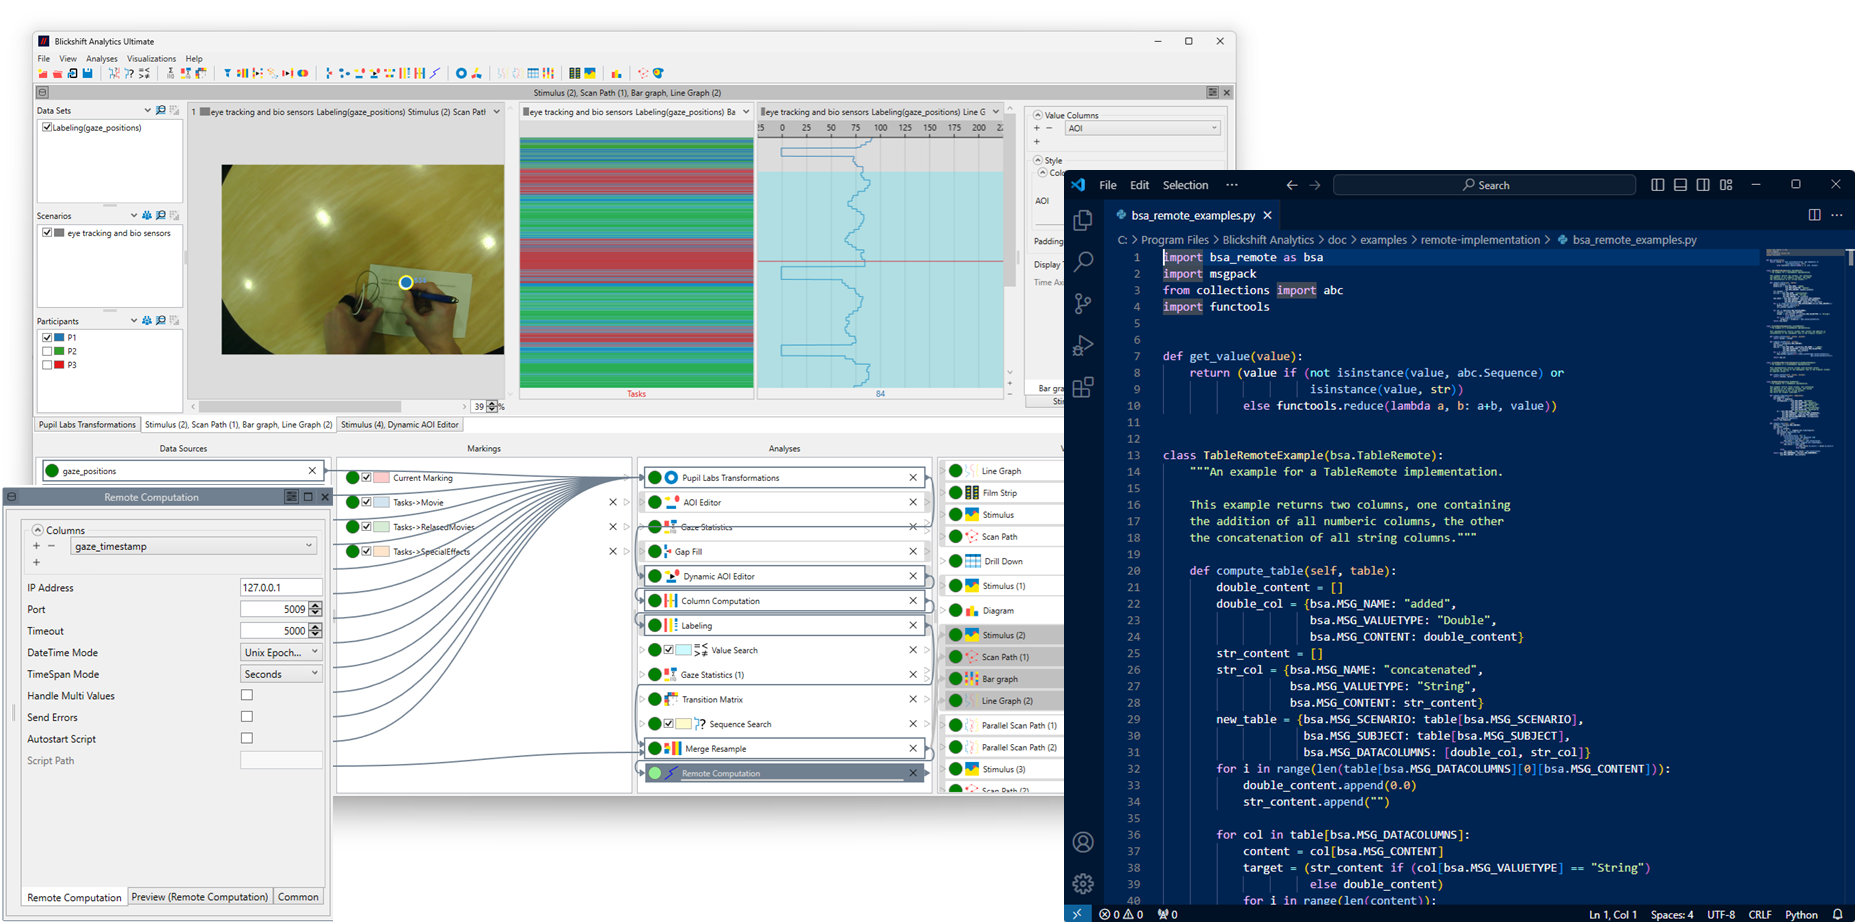
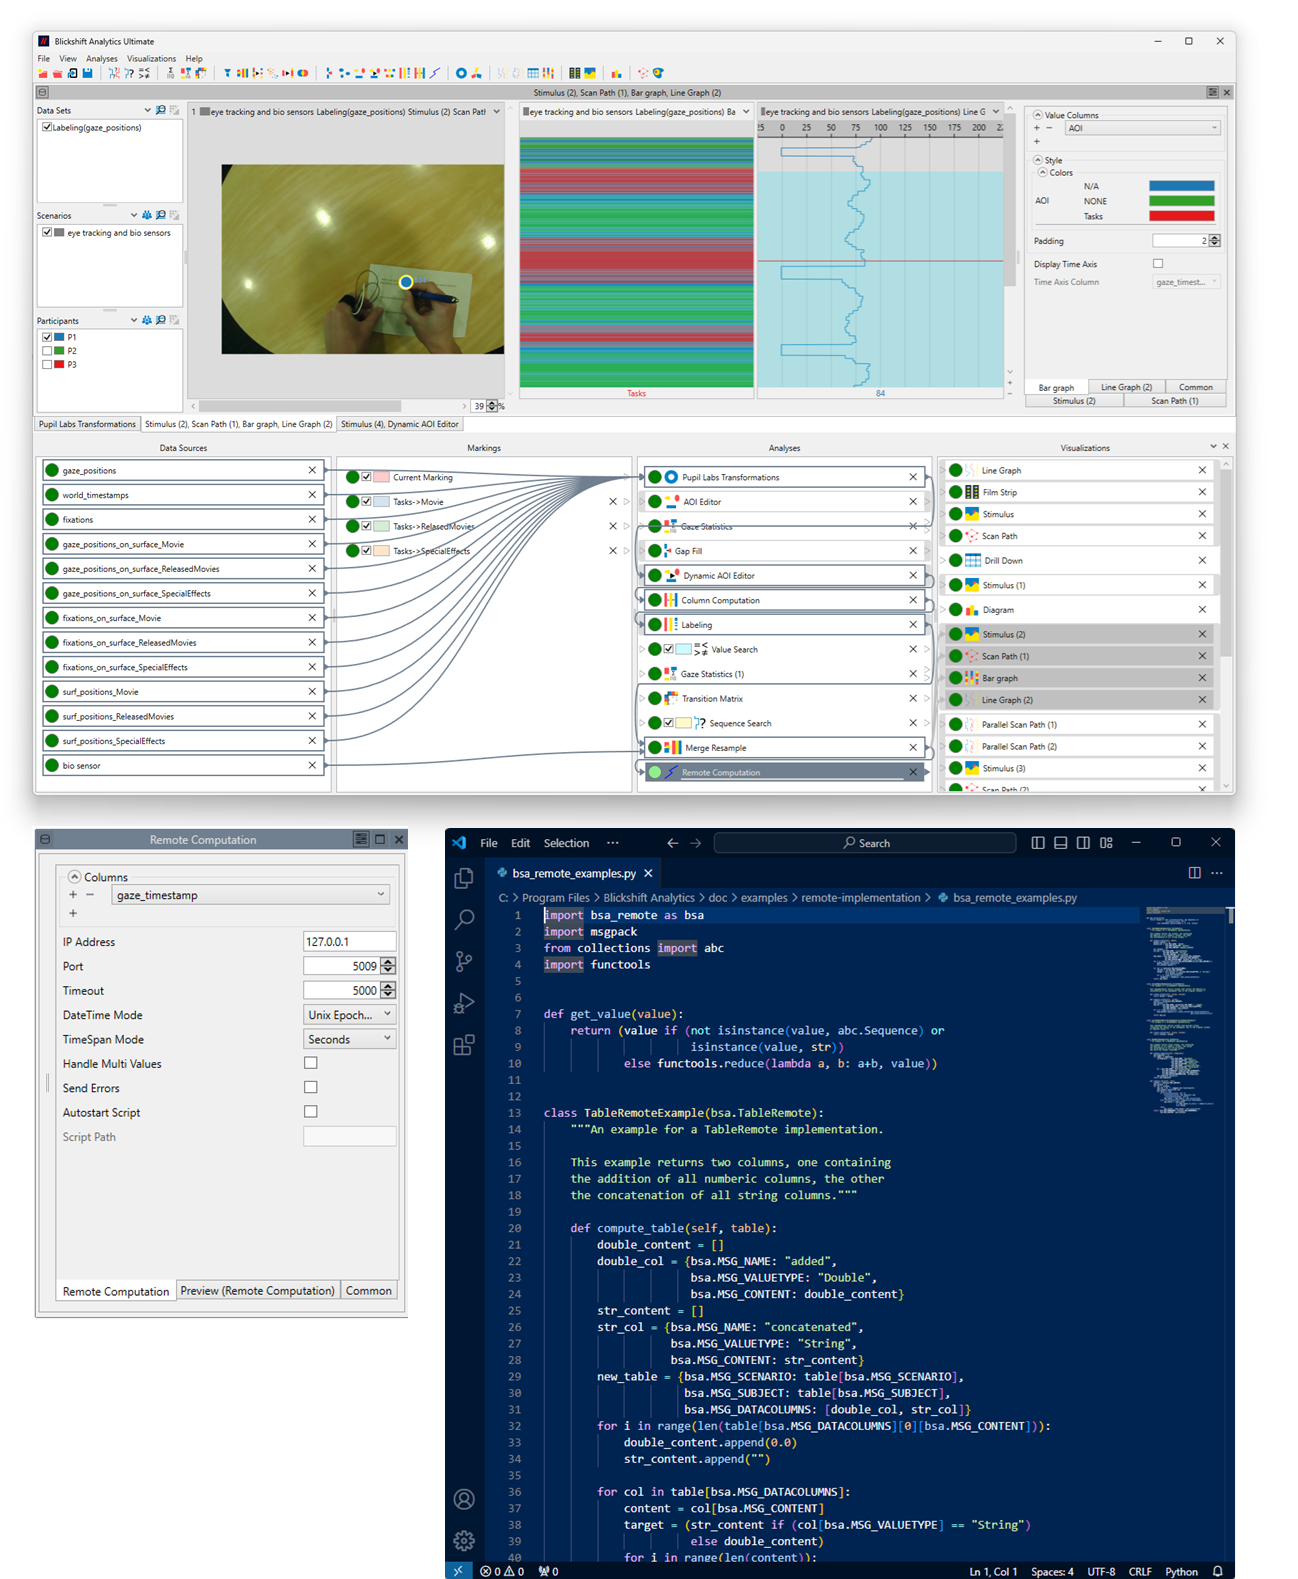
Interactively integrated into the analysis workflow, the new remote computation node connects the Blickshift Analytics data model directly to a Python script that is executed in a Python development environment. We offer extensive support for the integration of existing Python scripts or the development of new Python programs. In addition to a very good and detailed help section in the program manual, which contains all the necessary information on the data exchange protocol used, several Python sample files are supplied with the new version of our software. These can be opened directly in the Python development environment and adapted to your own requirements.
The data exchange between the script and Blickshift is controlled fully automatically and the eye tracking researcher can concentrate fully on the script development, supported by the diverse visualization options and analysis methods of our software. This also eliminates the time-consuming implementation of visualizations with other visualization frameworks or libraries. This saves time, nerves and, above all, allows our users to concentrate on the essential tasks: Algorithm development and validation, without having to re-implement or connect fundamental functionalities. This further reduces the time required to analyze eye tracking data and at the same time enables the sustainable use of existing analysis scripts. The power of Python and the libraries implemented in it open up completely new possibilities for extensive statistical calculations or the integration of AI processes.
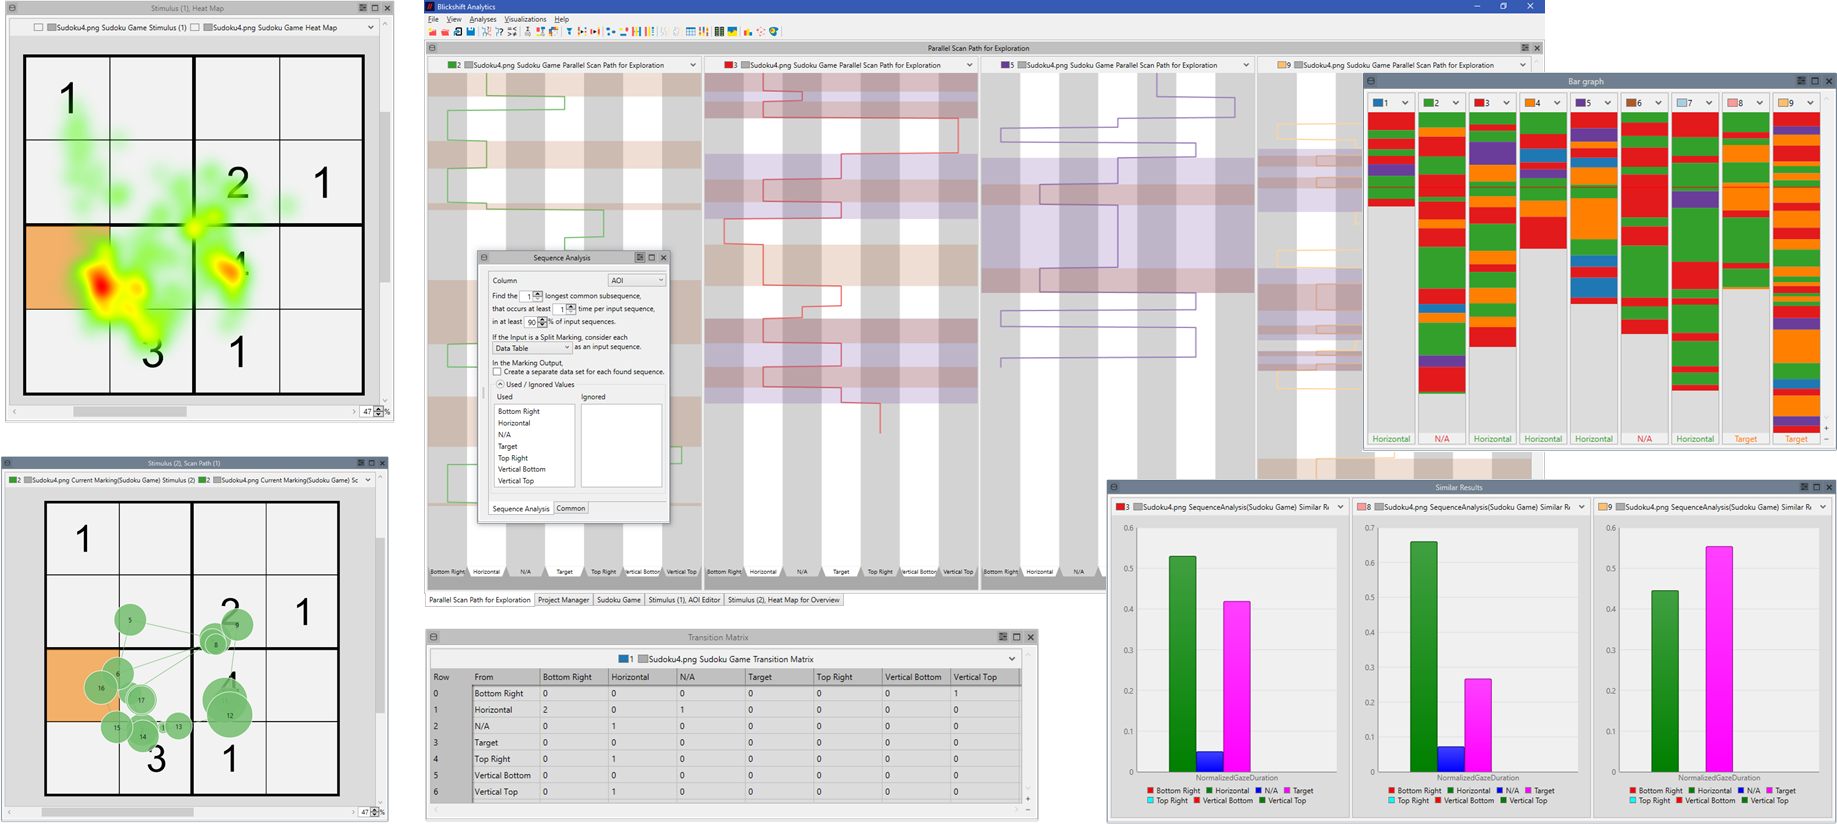
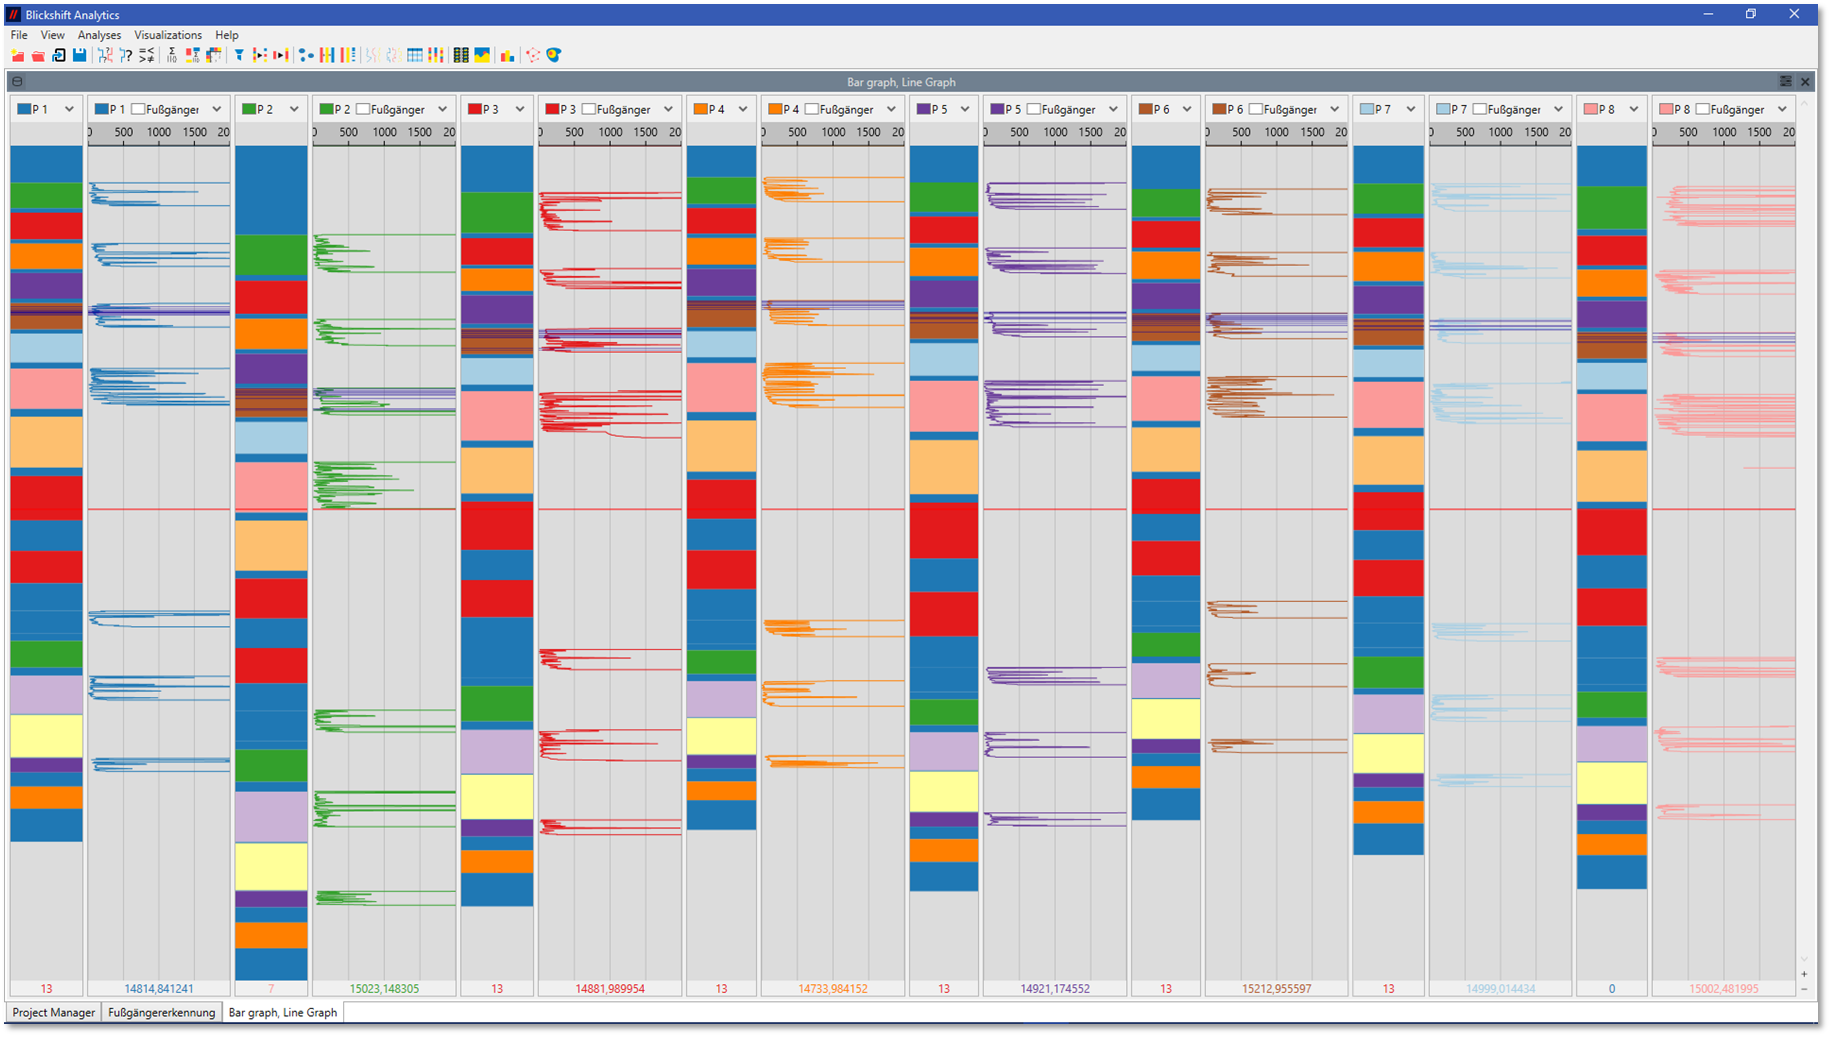
One of the great challenges in analyzing eye tracking experiments is the search for similar eye movements. Most times, visual methods like the comparison of scan path pattern with scan path visualizations or the computation of different eye tracking metrics is used. These methods lead to misinterpretations of the eye tracking data or to superficial results.
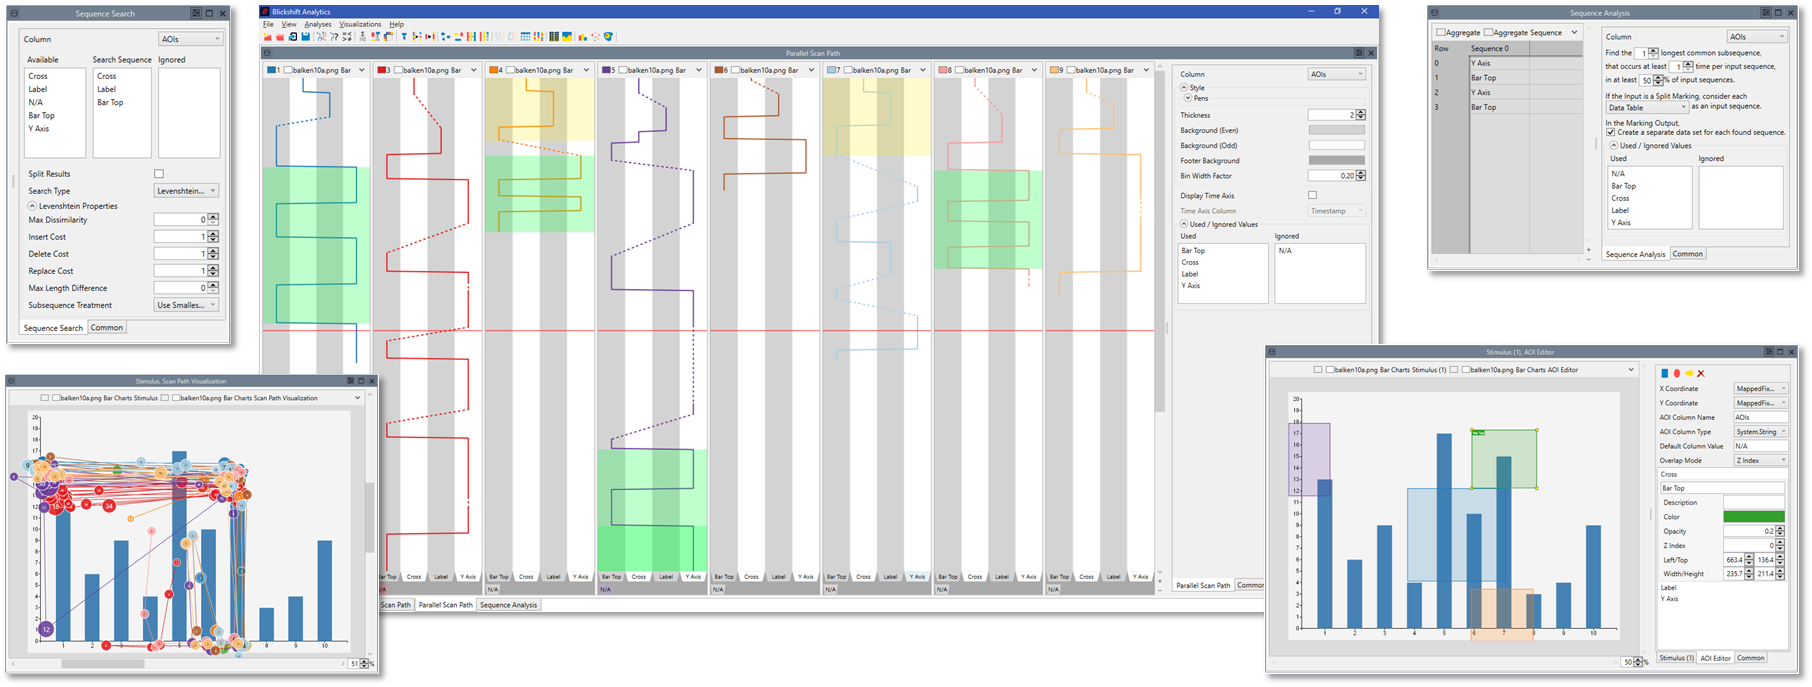
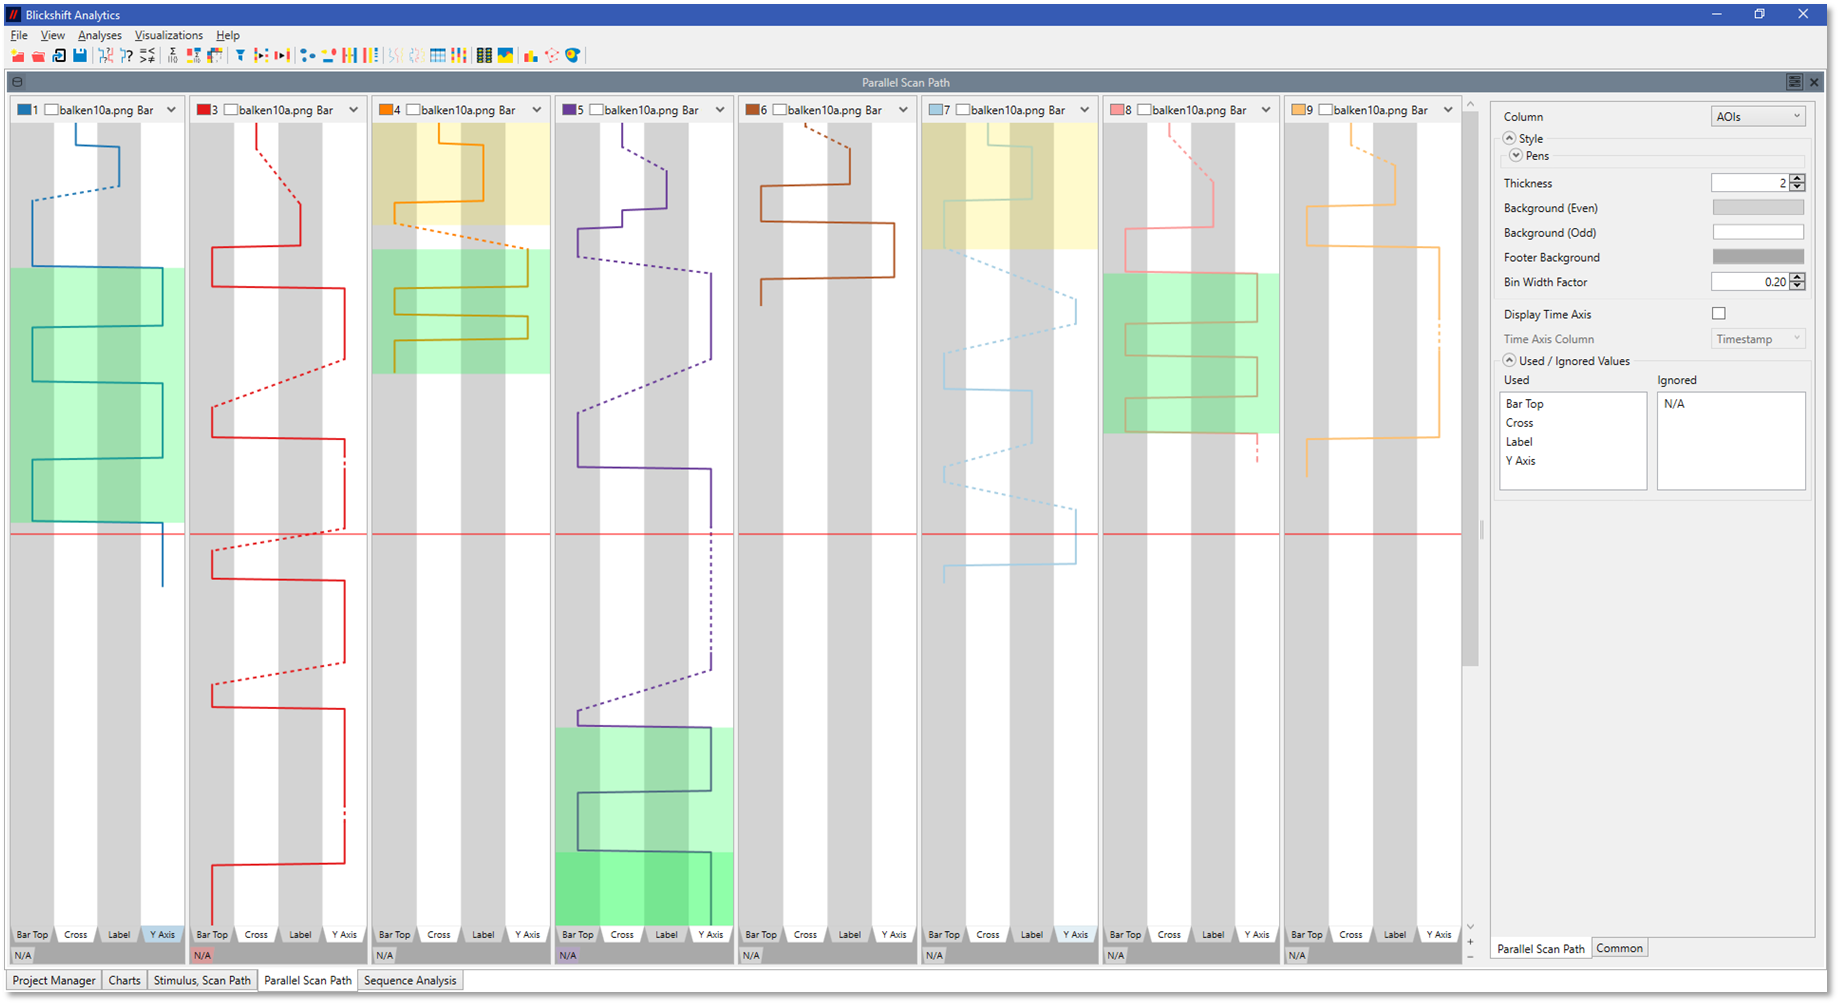
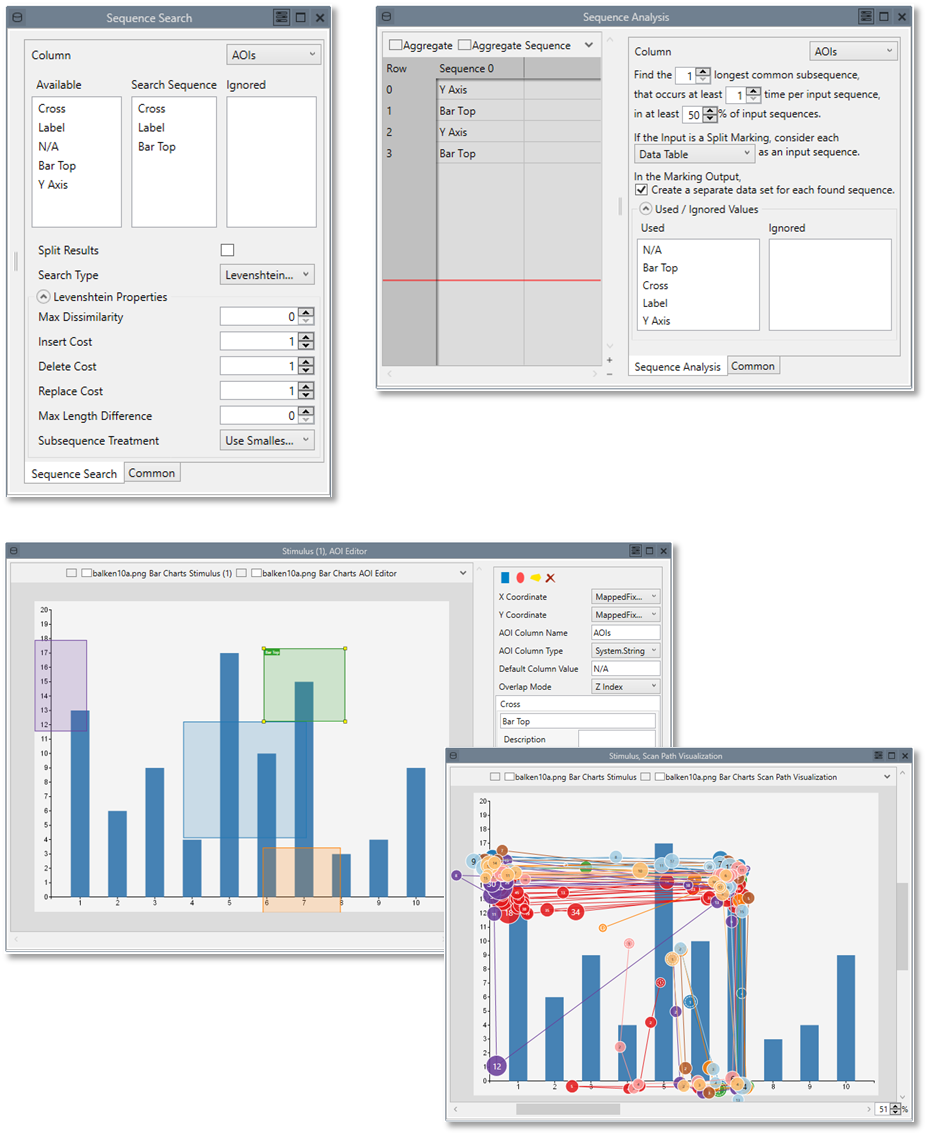
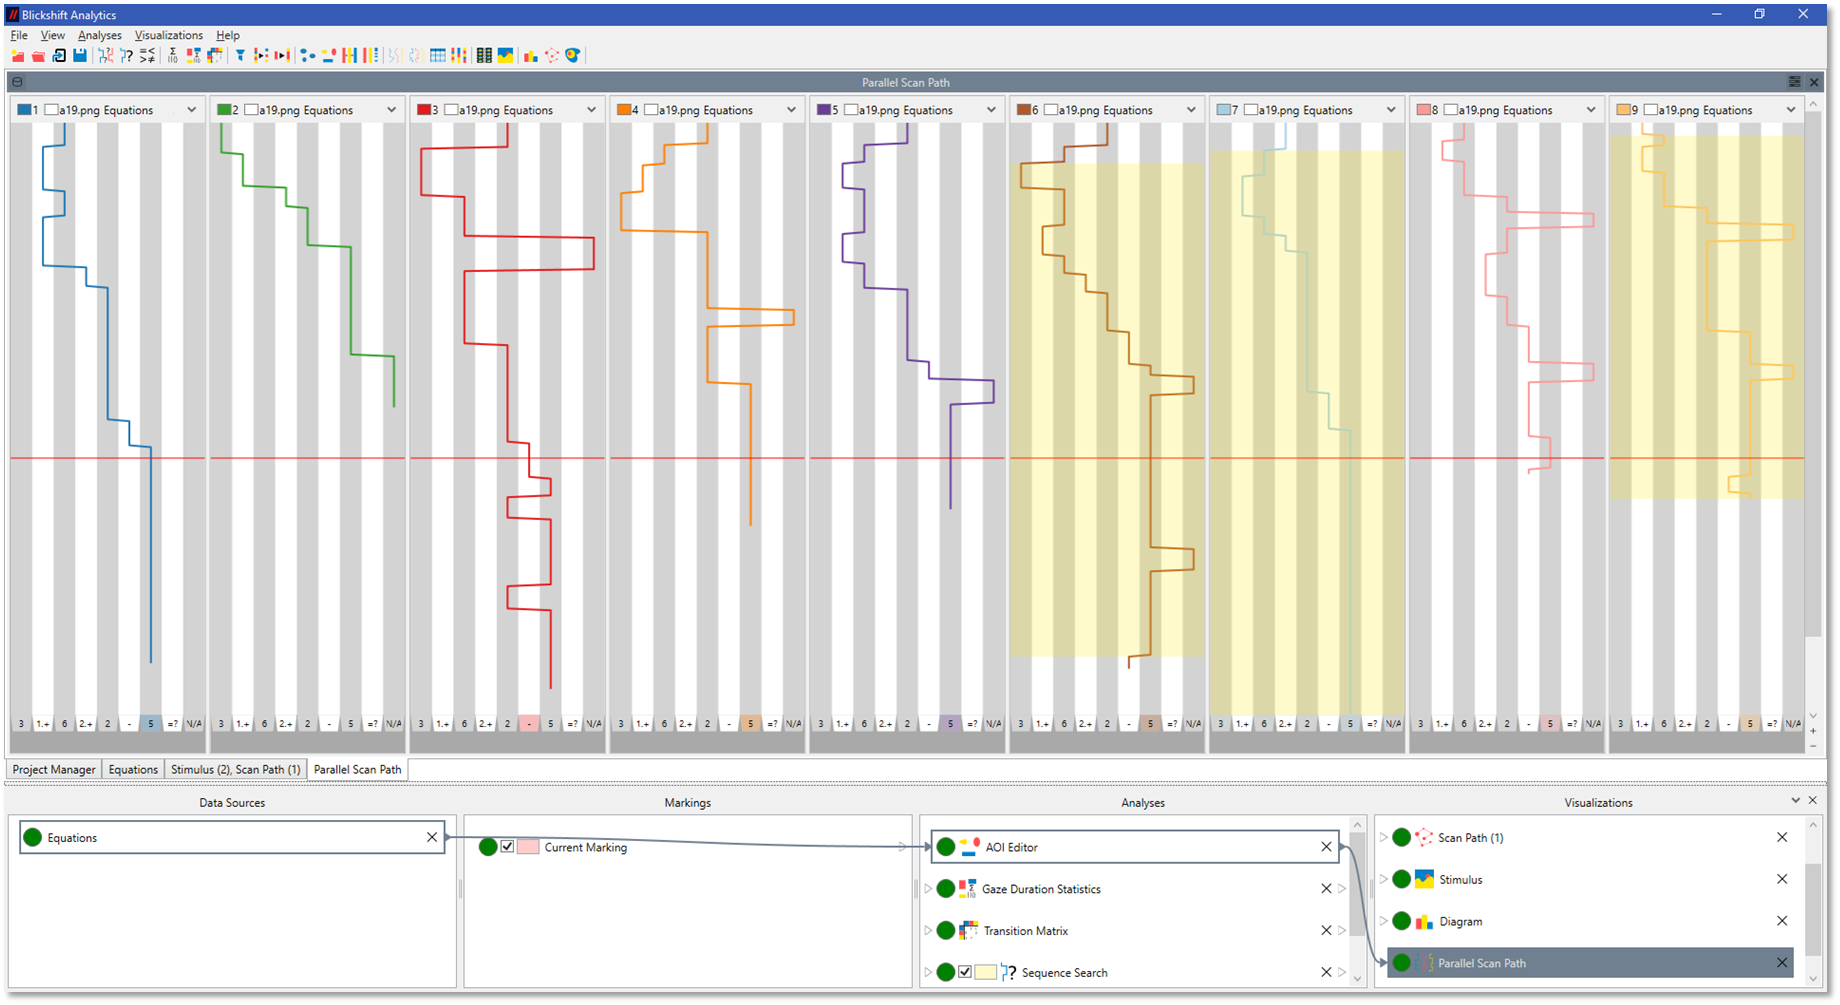
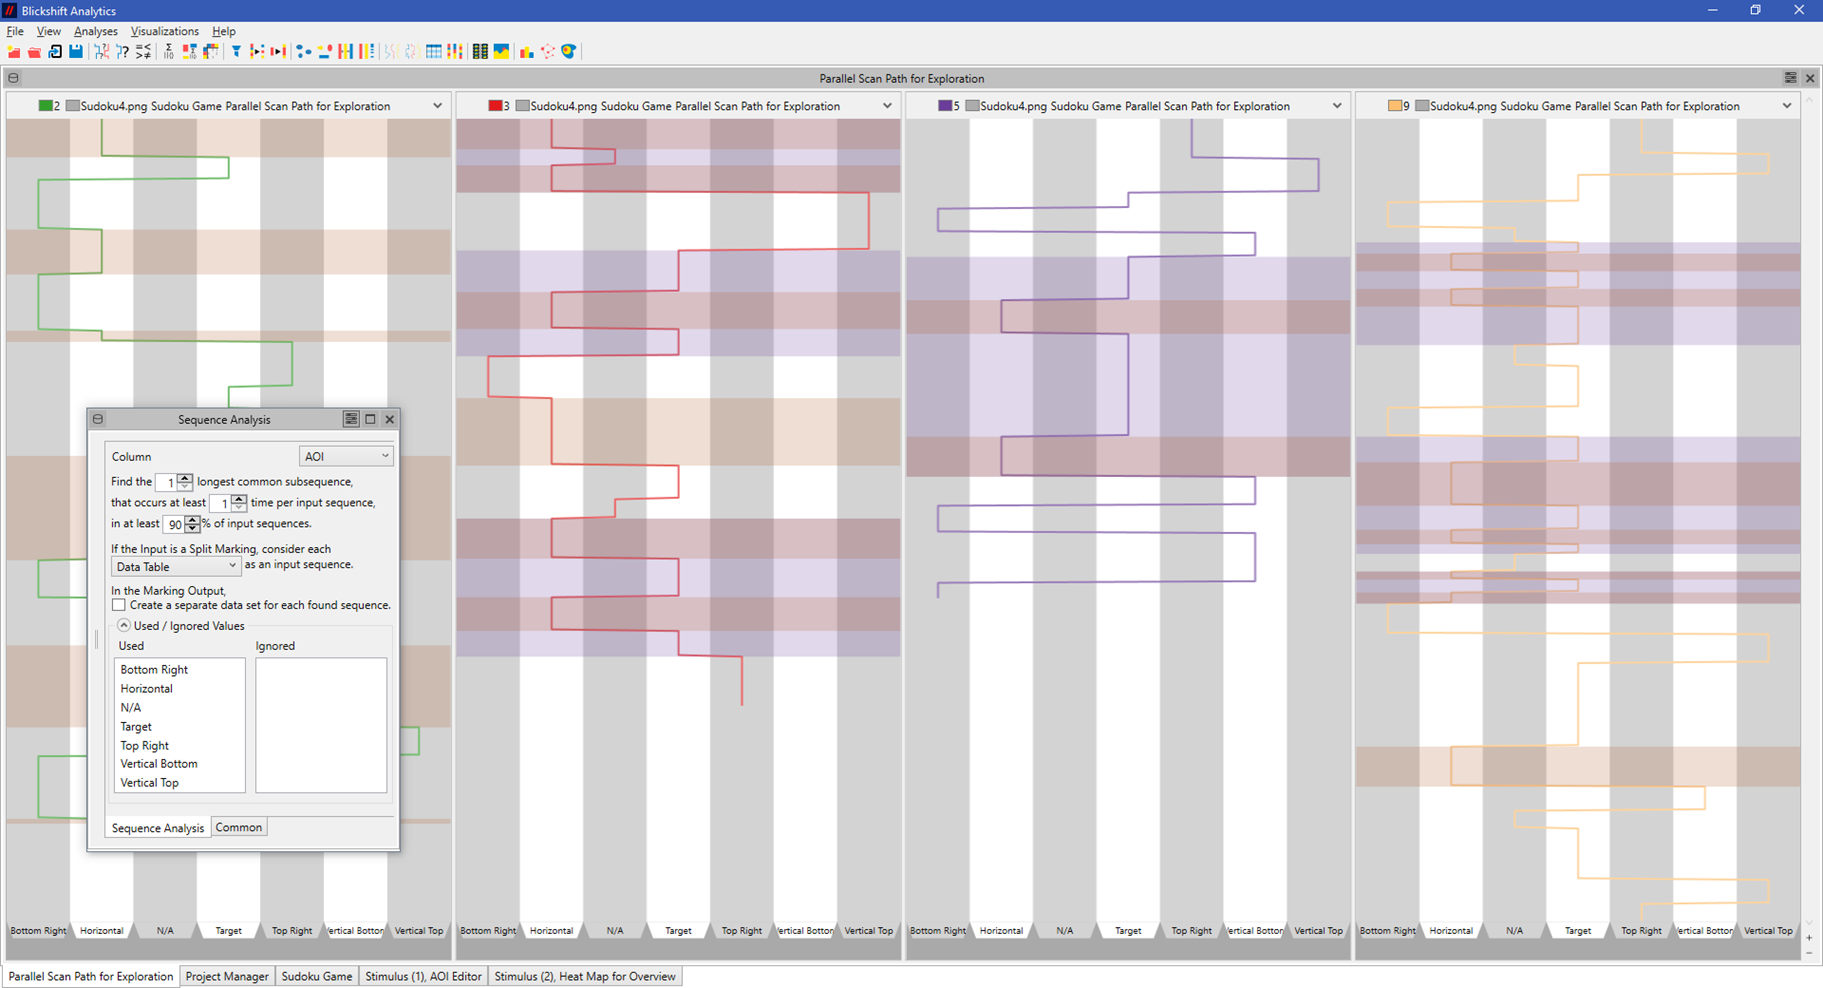
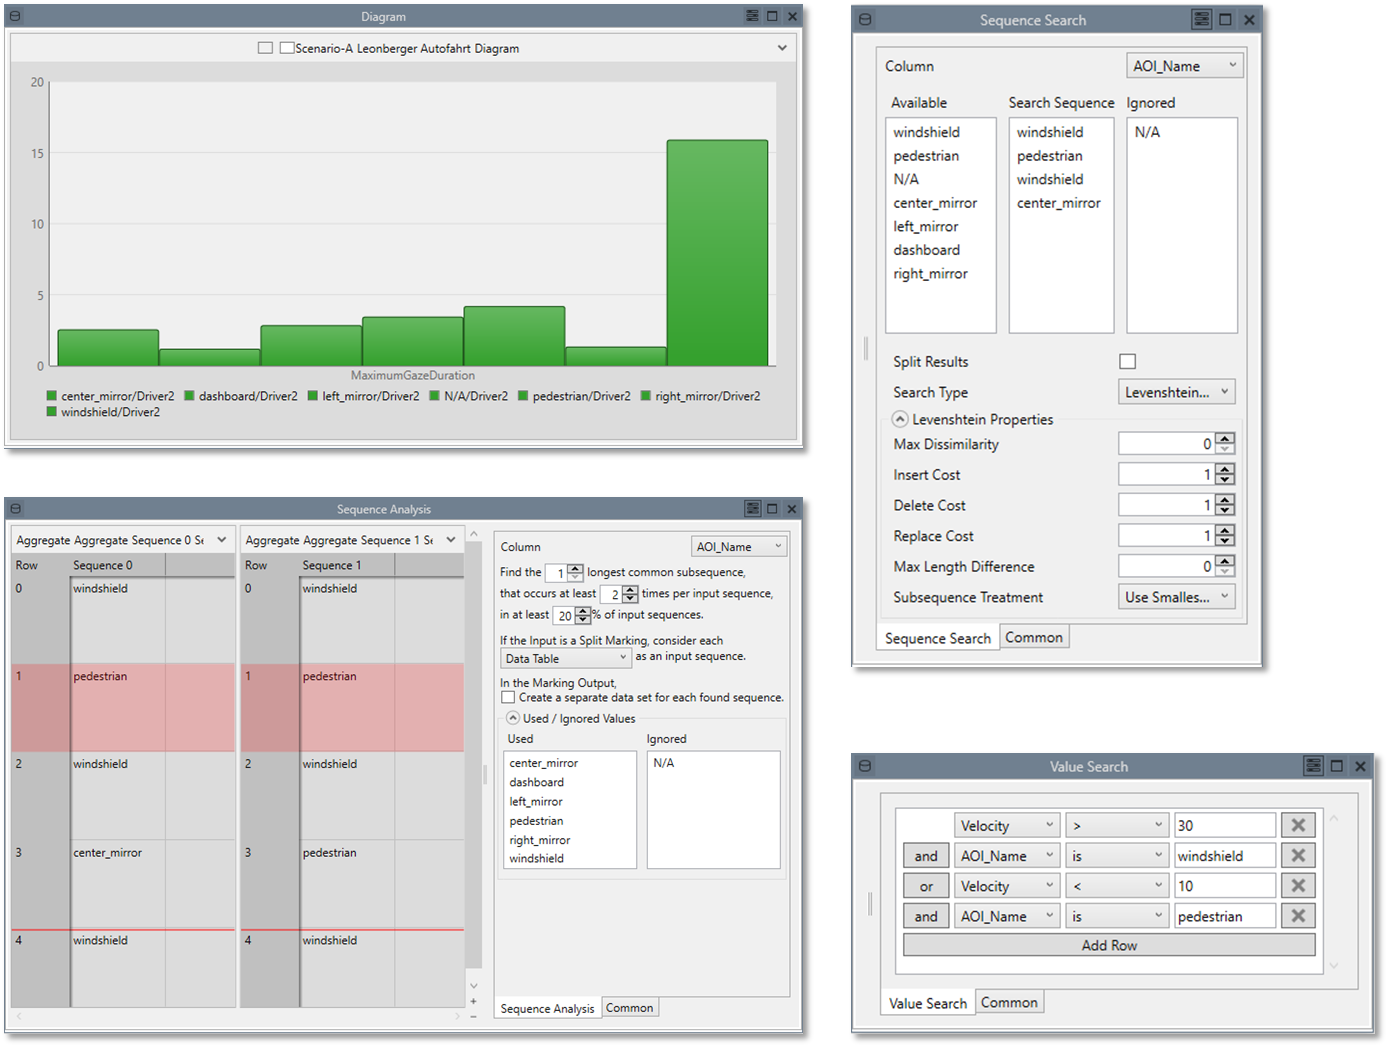
Blickshift Analytics offers two unique solutions: With an automatic search process our software identifies typical eye movements on an AOI basis. You can set all search parameters individually. In addition to the automatic search, a sequence search gives you the possibility to search for exact defined scan path patterns. Using a similarity search, our software also finds eye movements, which are not exact similar with respect to fixation order, but are similar.
Basically, there are two methods for analyzing eye tracking data: hypotheses-based methods and explorative methods. Both have advantages and disadvantages and are used by scientists for different analysis tasks.
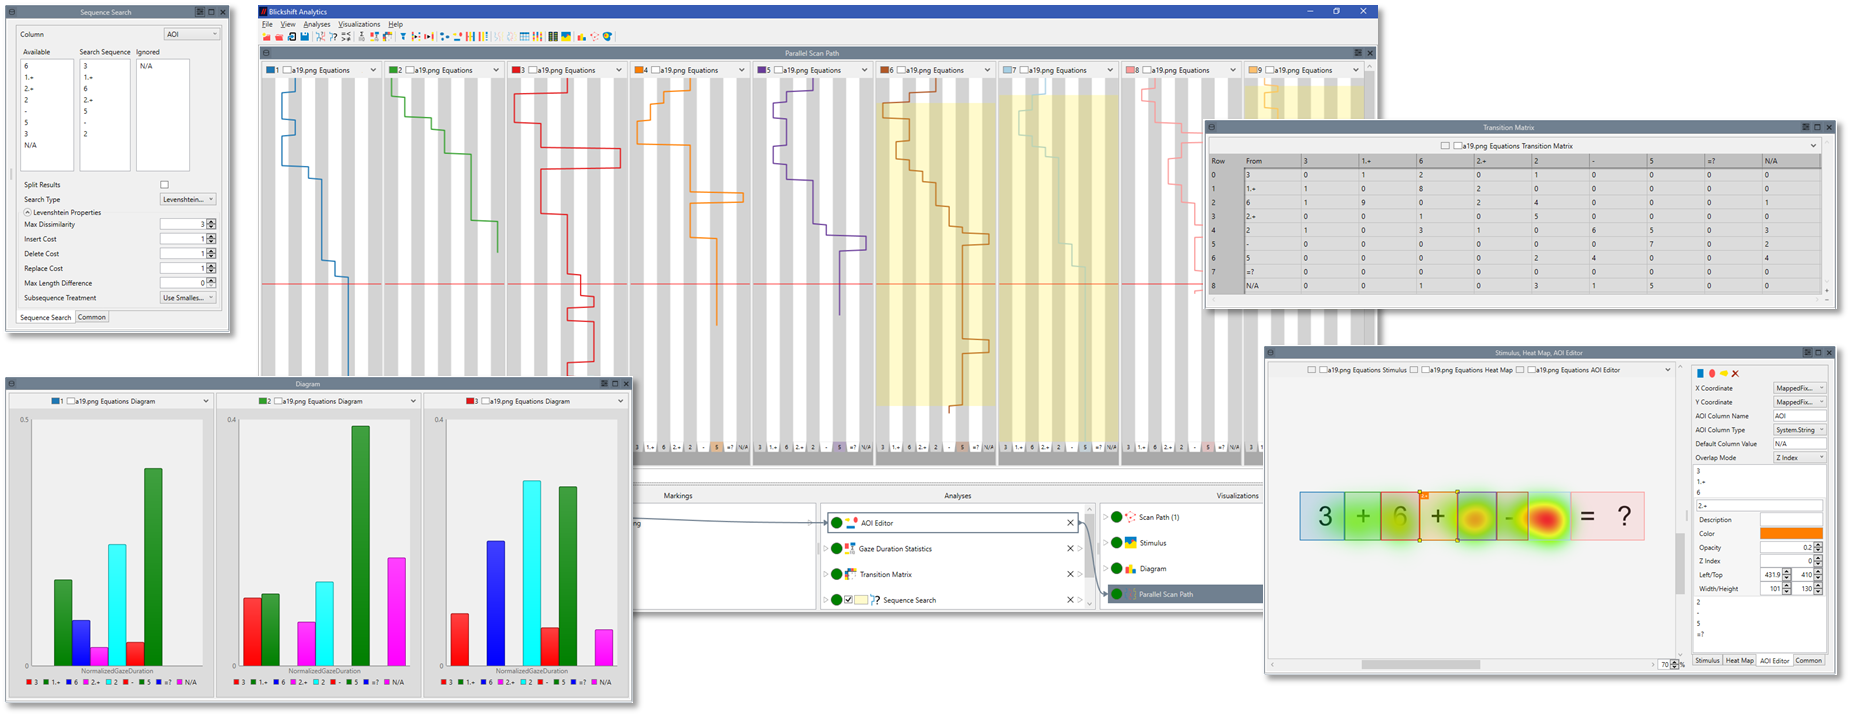
With Blickshift Analytics you can use both methods within one software application. Our software includes components for calculating all important eye tracking metrics as well as all necessary tools for an explorative, detailed analysis. All components are connected interactively with each other to provide you the best of the hypotheses-based and explorative approach for you.
In a first step, heat maps and scan path visualizations as well as statistical methods provide a good overview. However, the more detailed the analysis becomes, the more effort has to be invested for the analysis. In parallel, error rates increase due to possible errors during data exchange between different applications. In addition, the high dimensionality of recorded data with participants, stimuli and tasks has to be taken into account.
With Blickshift Analytics you can ensure the overview of your analysis in every moment. You can analyze your data step by step and increase continousely the level of detail of your results. Blickshift Analytics is designed according to the Information Seeking Mantra: At first, you get an overview about your data. Next, you filter all relevant information for your analysis with respect to your research questions. Finally, you focus your analysis on the details. In every step, our software supports you with the necessary visualizations and automatic components.
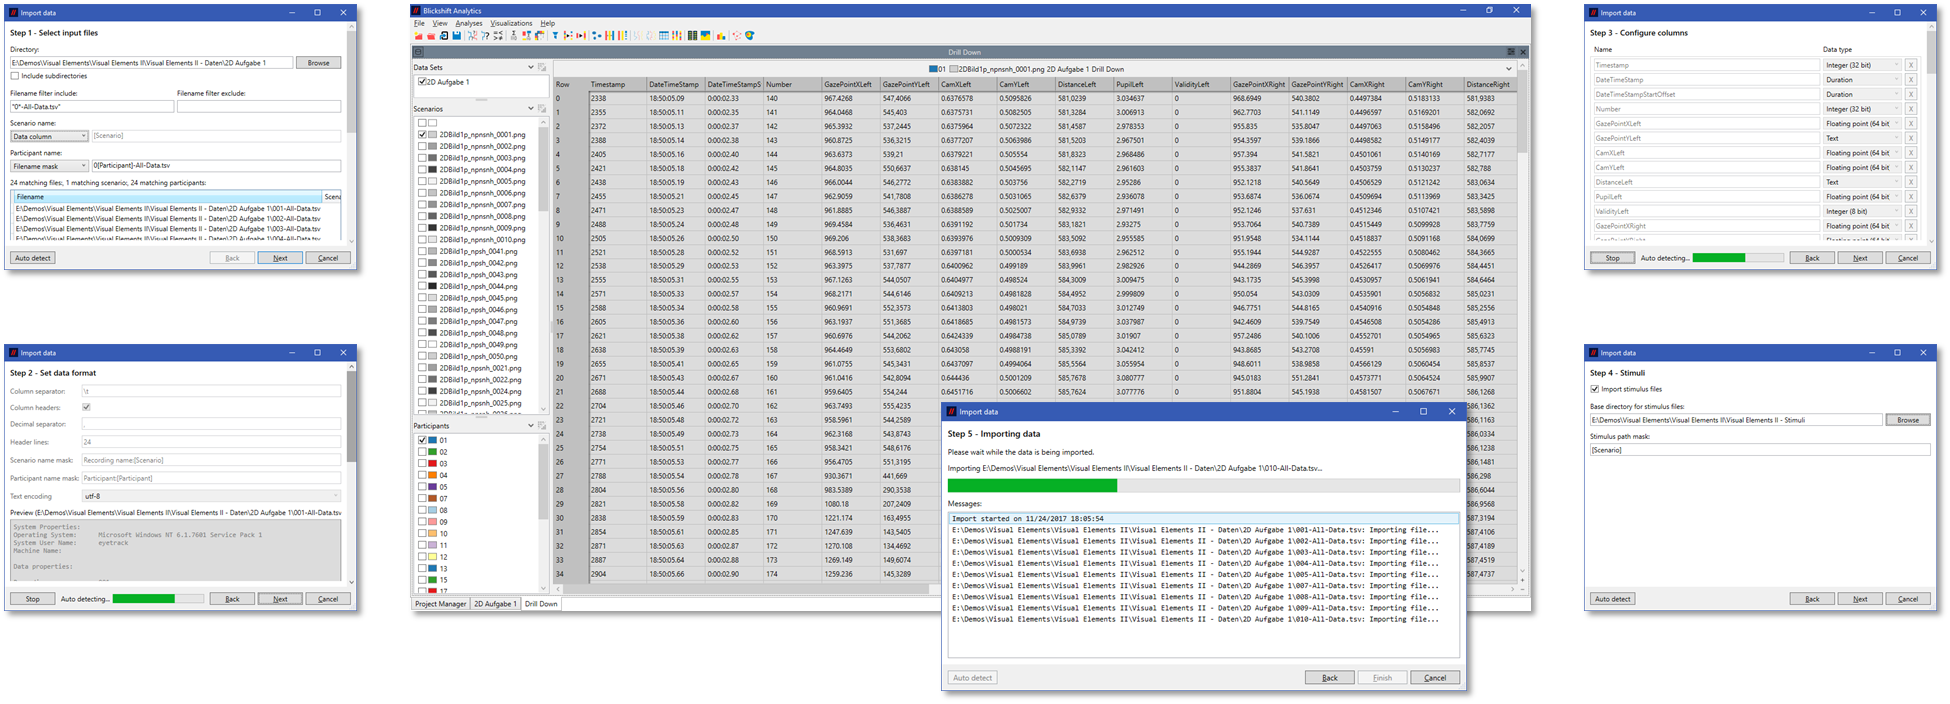
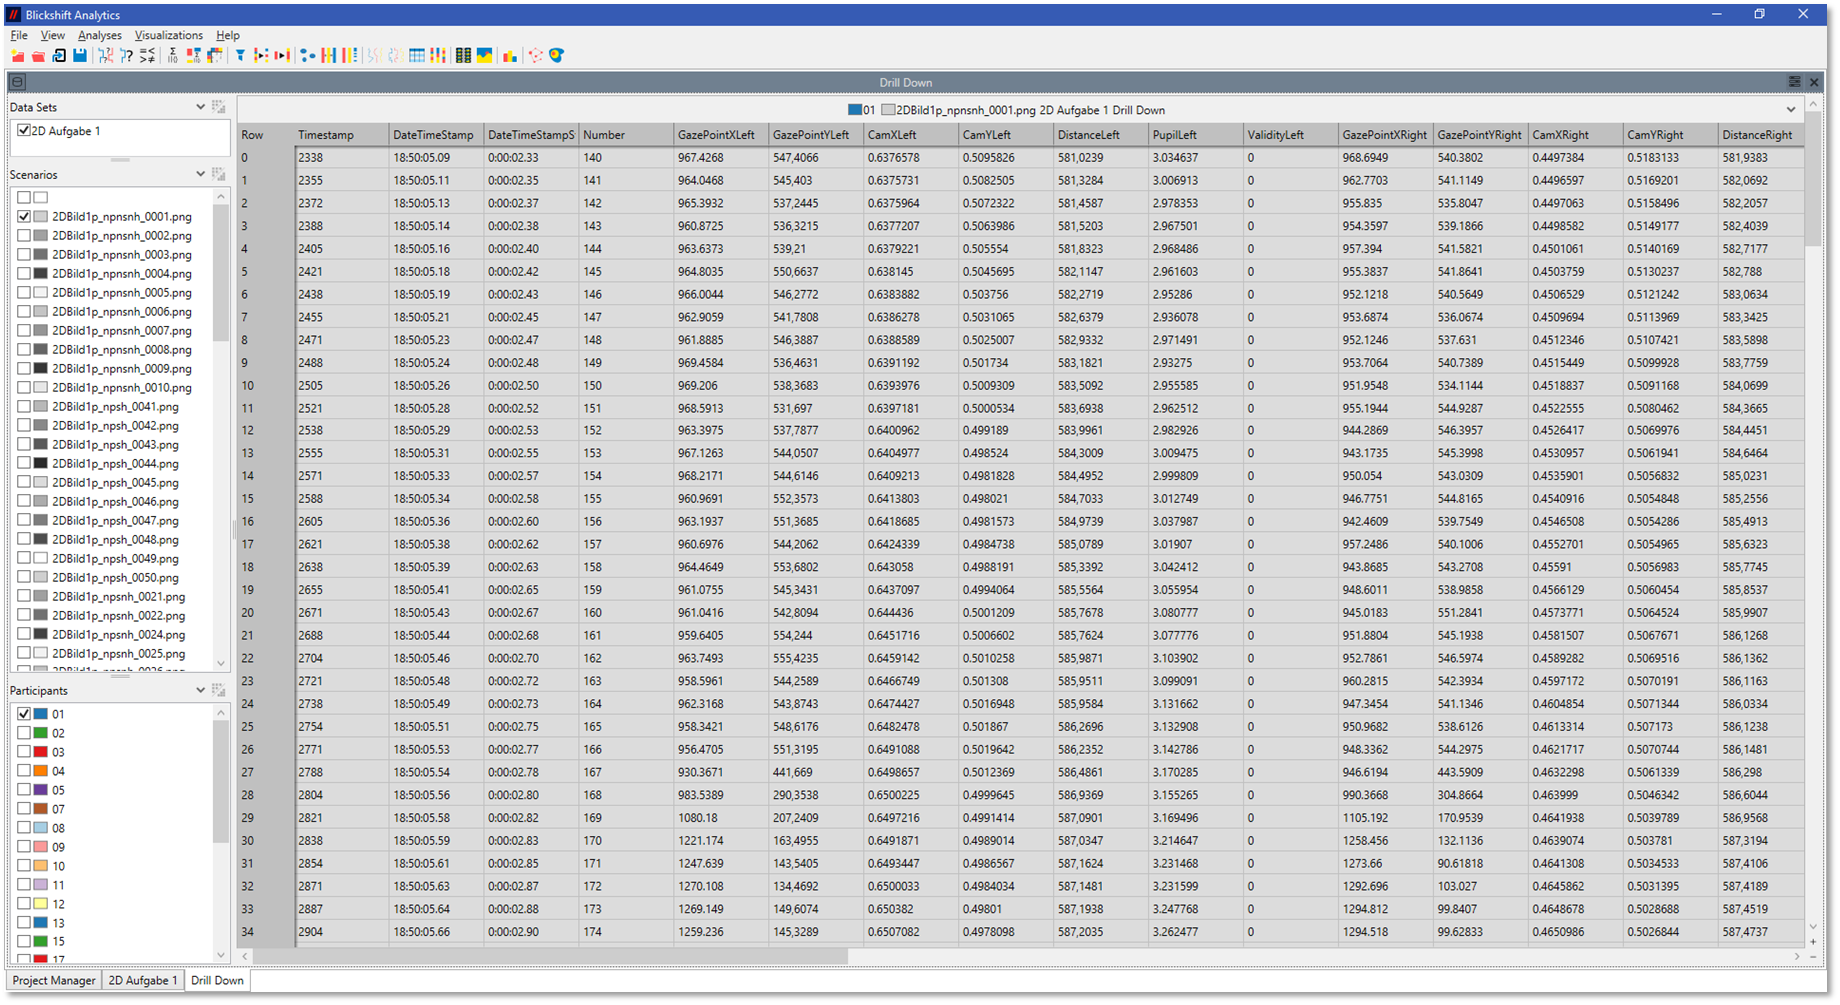
Since the millenium, several companies have brought eye tracking devices to the market. Different types of eye trackers cover various requirements of users. However, there does not exist a standardized file format for exchanging eye tracking data. For this reason, every eye tracking researcher has to develop different software interfaces for the data exchange.
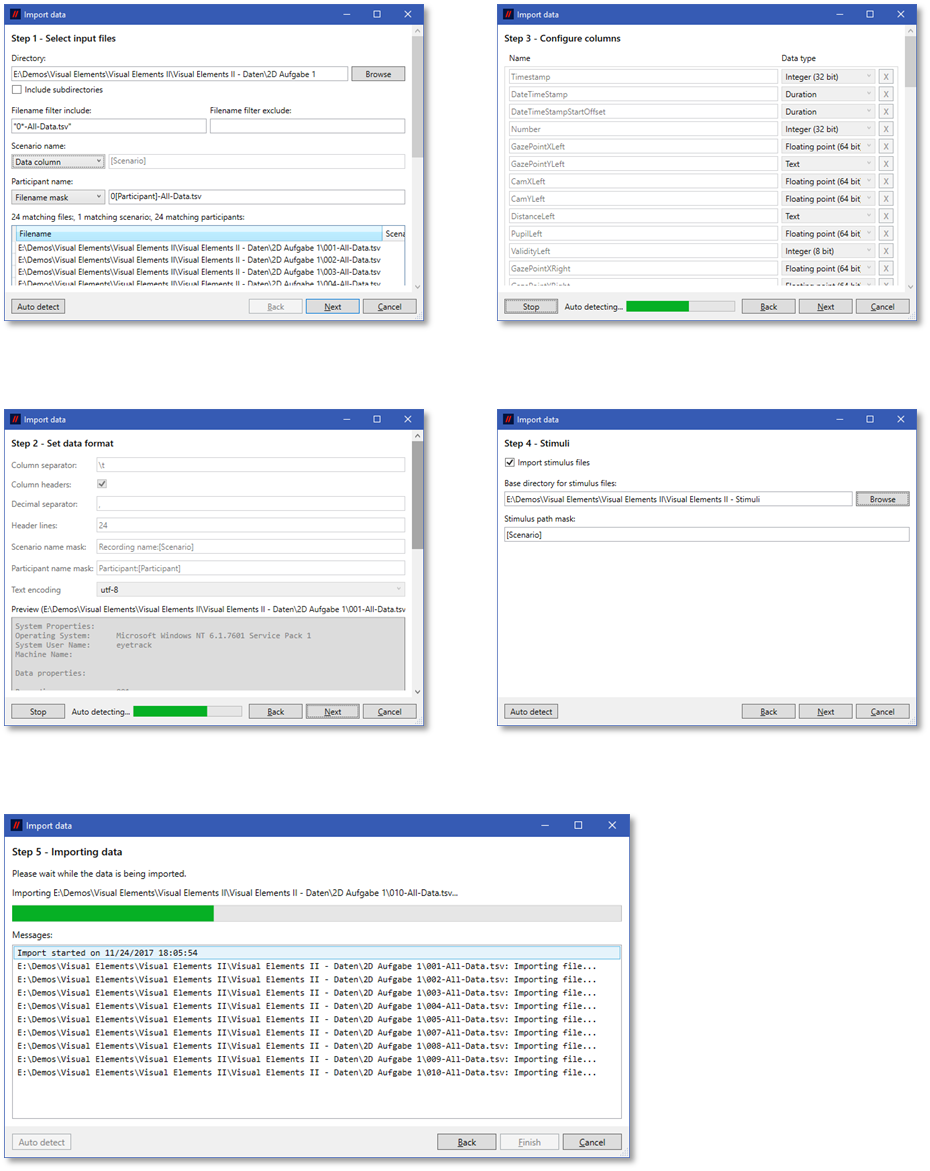
This is not necessary, if you are using Blickshift Analytics. An automatic heuristic detects the file format and imports all data correctly. In the advanced import mode you can manually set all import parameters.
Most times, there is an existing analysis workflow using classical data analysis software like MATLAB, R, SPSS and others. If a new software has to be integrated in a workflow, existing software has to be adapted or, in the worst case, has to be re-implemented.
We have reduced the effort for integrating Blickshift Analytics in an existing software environment to a minimum. At every moment of the analysis, you are able to export results of calculations and data sections in CSV files. Additionally, you can export bitmaps of visualizations or do an easy copy and paste via clipboard into presentation software.
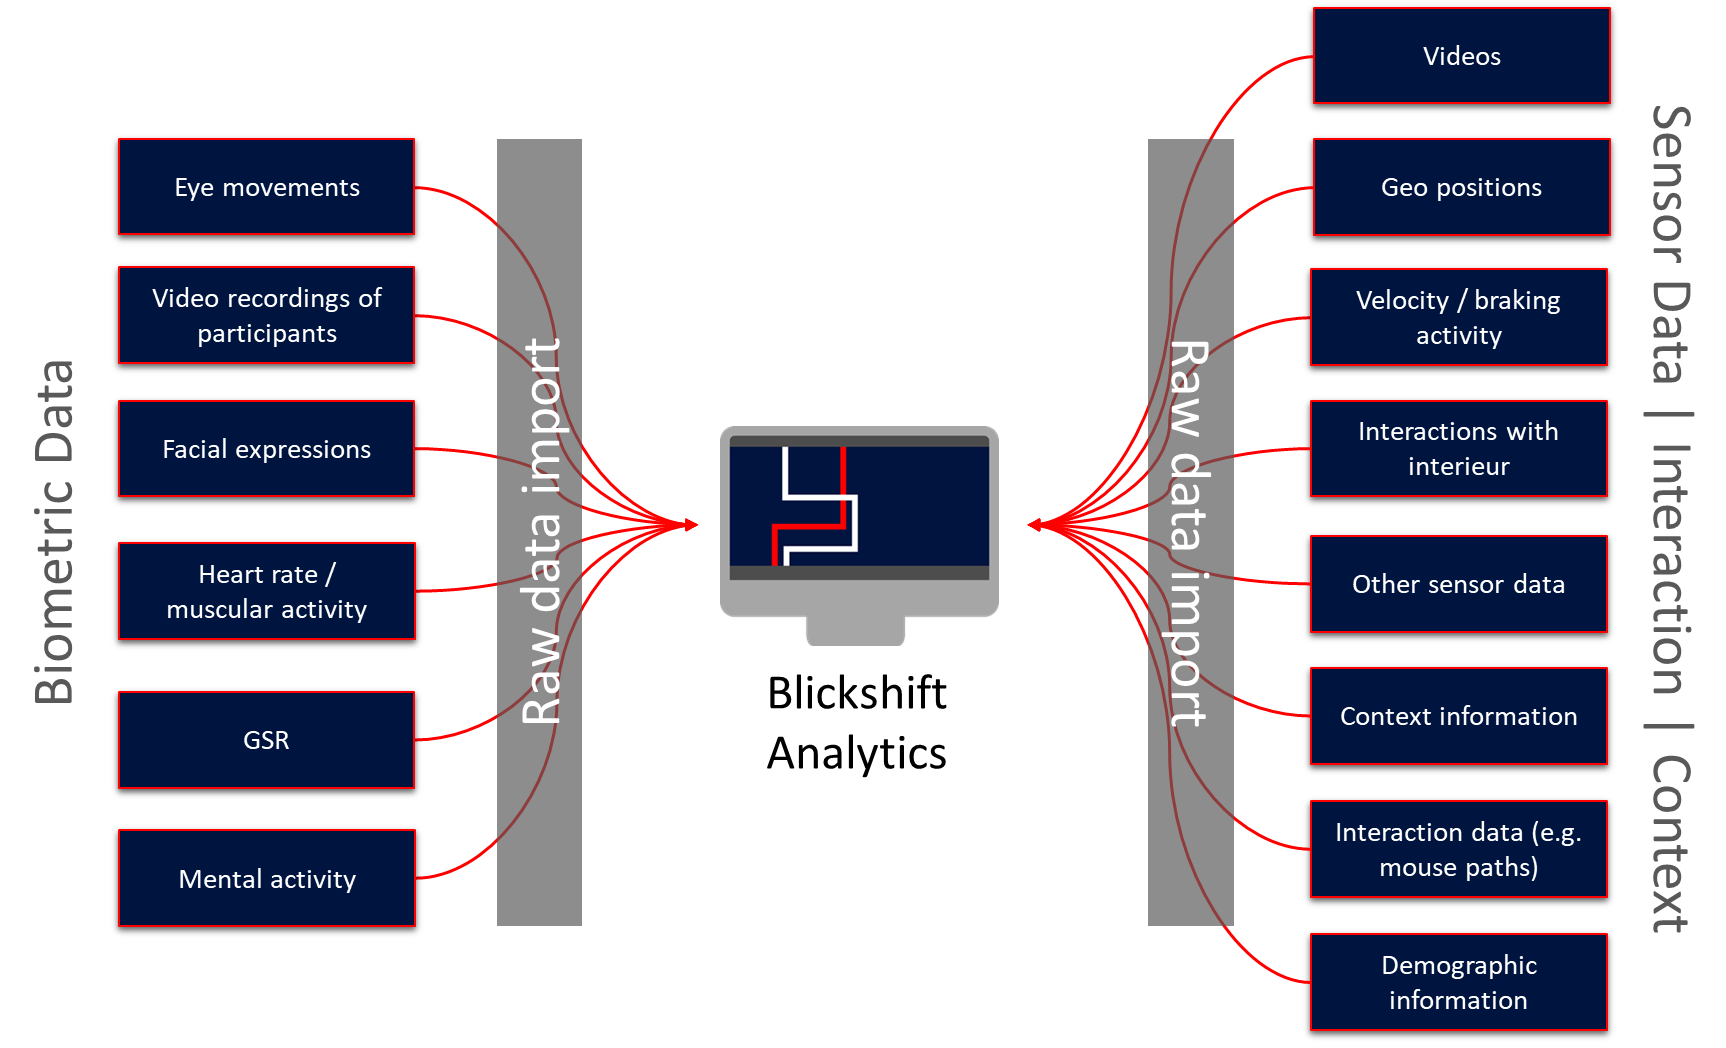
In many eye tracking experiments not only eye movements have been recorded, but also biometric values like galvanic skin response or heart rate frequencies. Eye movements have to be interpreted together with these sensor channels. Further data sources are interaction logs (e. g. mouse paths on the screen) or other sensors in the experiment environment.
In Blickshift Analytics you can import all these data channels together. Next, you analyze all information together to find correlations between eye movements and physiological data and other sensors. Or, you can compare mouse paths and scan path with only a few steps in our software.
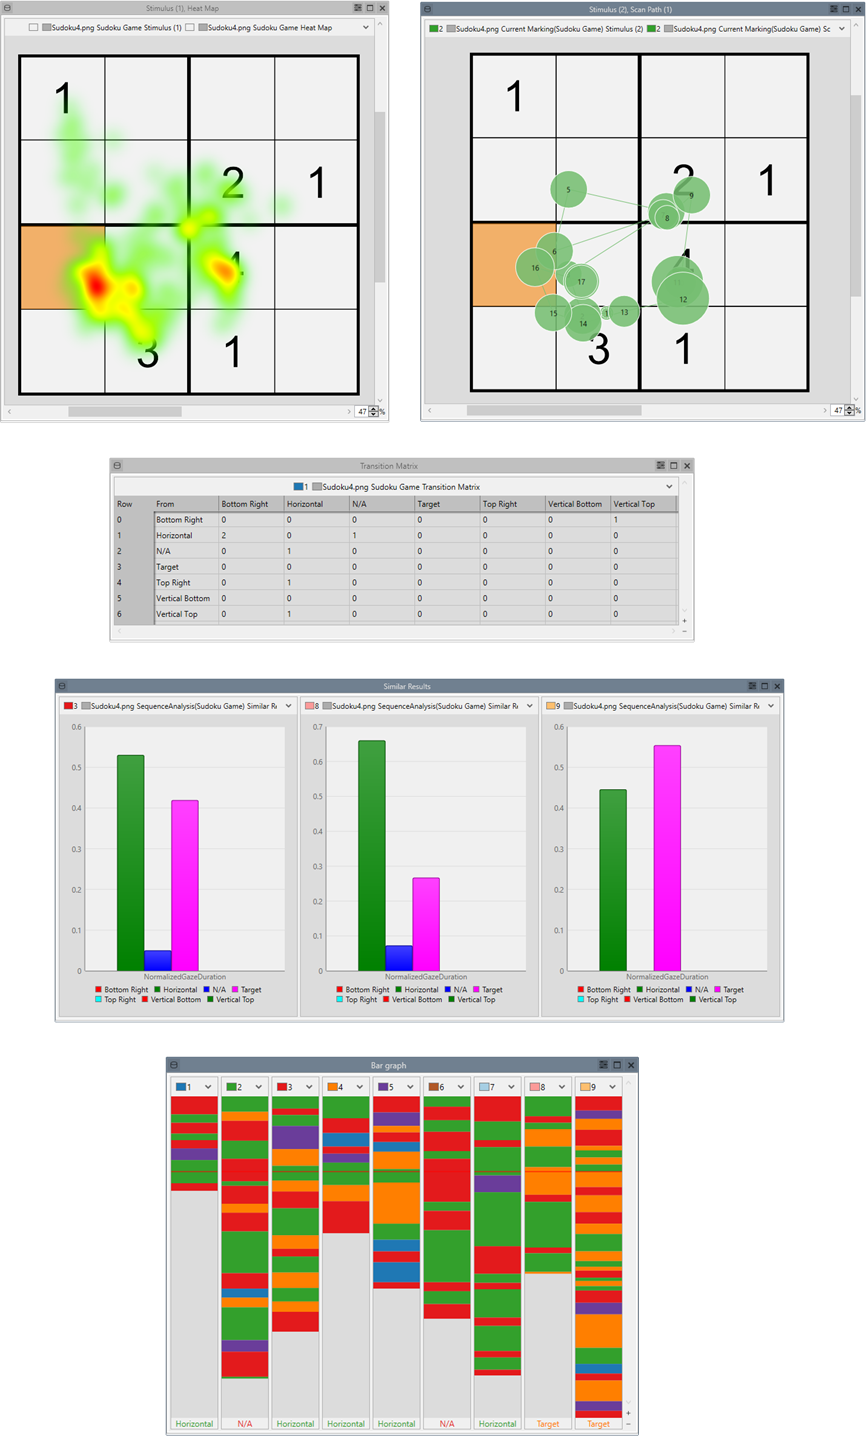
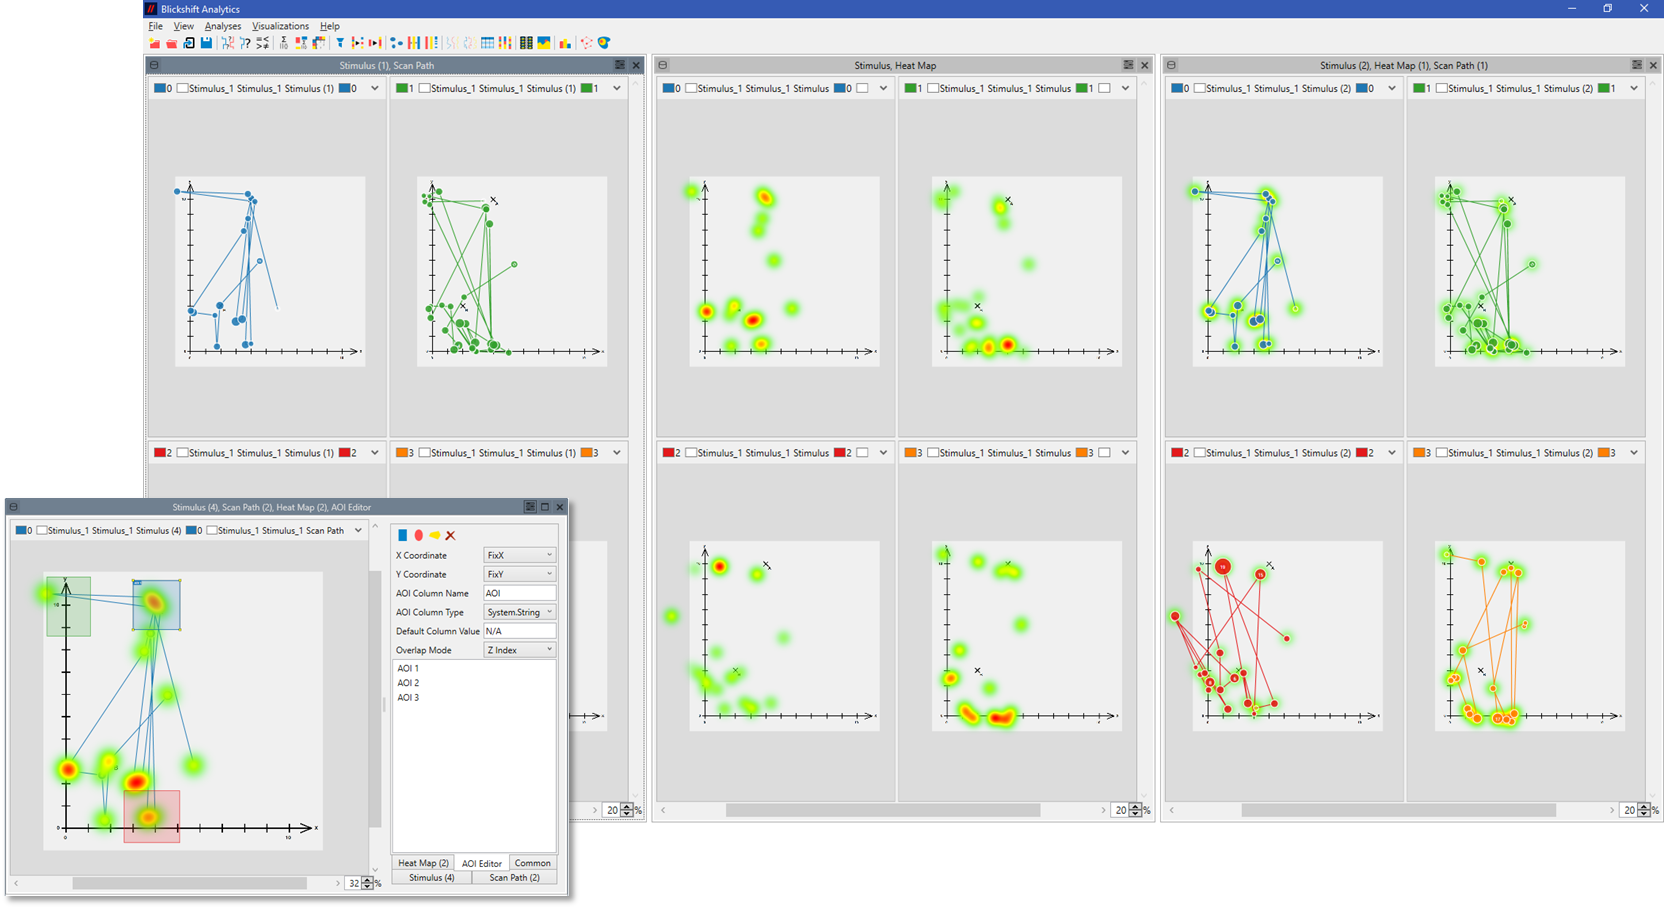
Every scientist knows heat maps and scan paths. Both visualization techniques have played a key role to spread eye tracking technology into many labs around the world. These visualizations are easy to understand. However, they have significant disadvantages with respect to their meaningfulness. On the one hand, different visualization parameters can lead to misinterpretations when reading heat maps. On the other hand, scan paths get visual-cluttered when they show more participants at once.
Of course, Blickshift Analytics also gives you the possibility to present your data with heat maps and scan paths. However, we have enhanced these two classical techniques with further visualization parameters and interactions. Further, we have closely connected them with all components within our software. Thereby, you get completely new powerful possibilities to still use these two classical visualizations in the future.
Eye-Tracking-Experimente in der realen Welt stellen eine der aufwendigsten Studiendesigns in der Erforschung der visuellen Wahrnehmung dar. Die Besonderheit, dass mit Head-Mounted-Systemen gearbeitet wird und jeder Proband zu unterschiedlichen Zeiten variierende Stimuli betrachtet hat, macht eine quantitativ vergleichbare Ermittlung von Besonderheiten im Blickverhalten sehr zeitaufwendig oder oft sogar gar nicht sinnvoll möglich.
Hier bietet Ihnen Blickshift Analytics verschiedene Lösungen an: Zum einen können Sie Videoaufnahmen der Head-Mounted-Systeme zusammen mit weiteren Szenenkameras für die Analyse verwenden. Direkte situationsabhängige Überblendungen von Scan-Paths und Heat-Maps in das Head-Mounted-Video geben Ihnen einen direkten Einblick in das Sehverhalten der Probanden. Liegen AOIs aufgrund einer manuellem Annotierung der Fixationen (ebenfalls direkt in Blickshift Analytics möglich) oder Ergebnisse aus Bilderkennungsverfahren vor, können Sie den vollen Funktionsumfang der Sequenzanalyse ebenfalls nutzen. So werden Experimente in der realen Welt genauso leicht analysierbar wie Experimente unter Laborbedingungen!
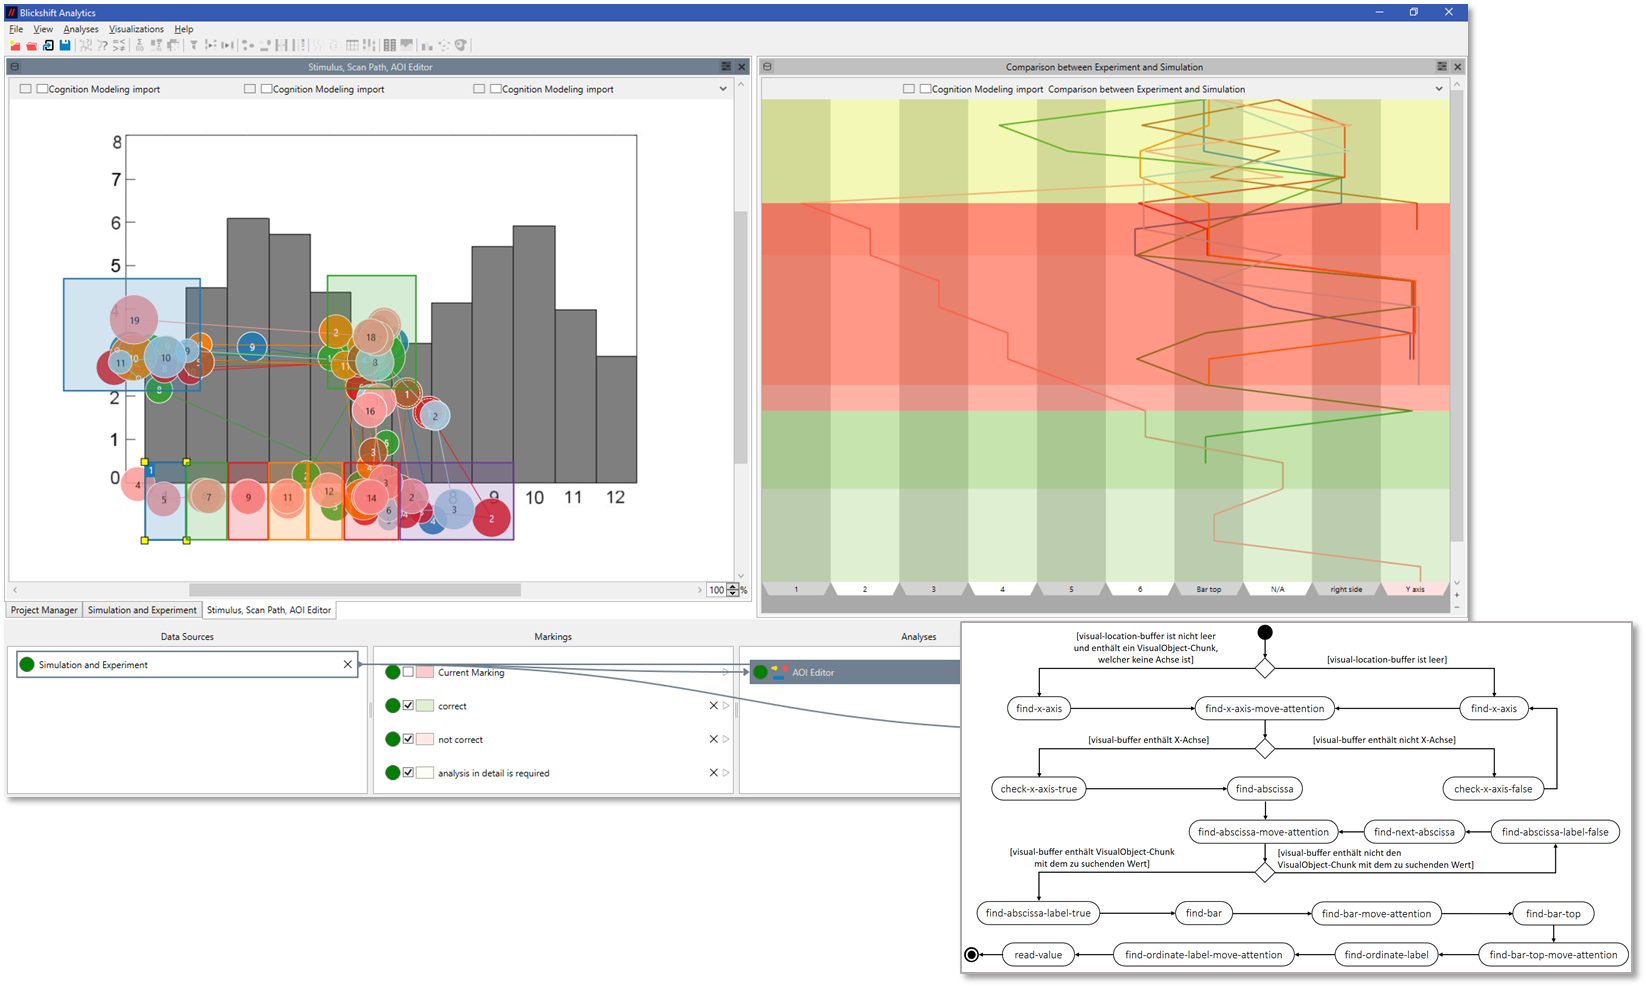
One research question in Perception and Cognitive Sciences is the modeling of human vision. Thereby, models are developed to predict fixations on given stimuli. One open research question was so far, how to evaluate simulated fixation paths and how to optimize models with a simple method.
Since one particular feature of Blickshift Analytics is to compare scan paths very efficiently, you can now easily compare your simulated eye movements with recordings from experiments. Our software supports you with different visualization techniques, sequence analysis components and calculation methods of eye tracking metrics. With a few mouse clicks, you can identify all relevant model parameters for a further optimization.
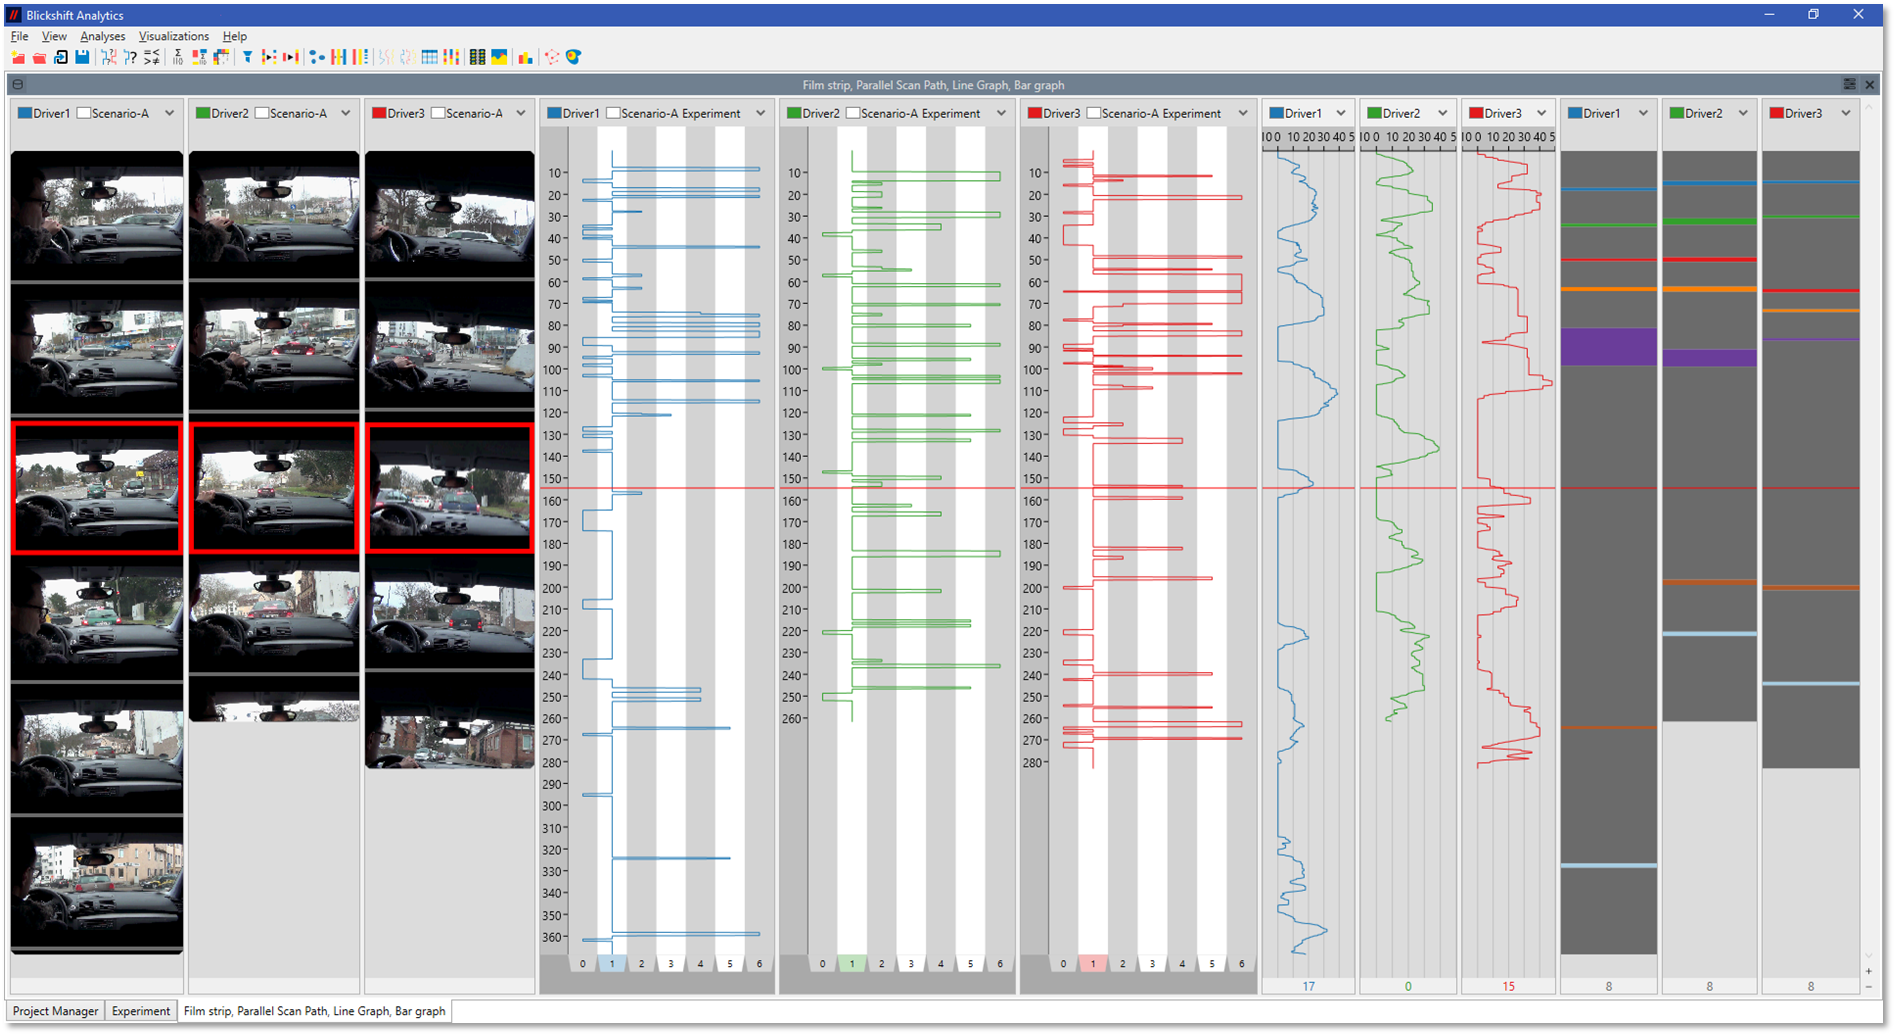
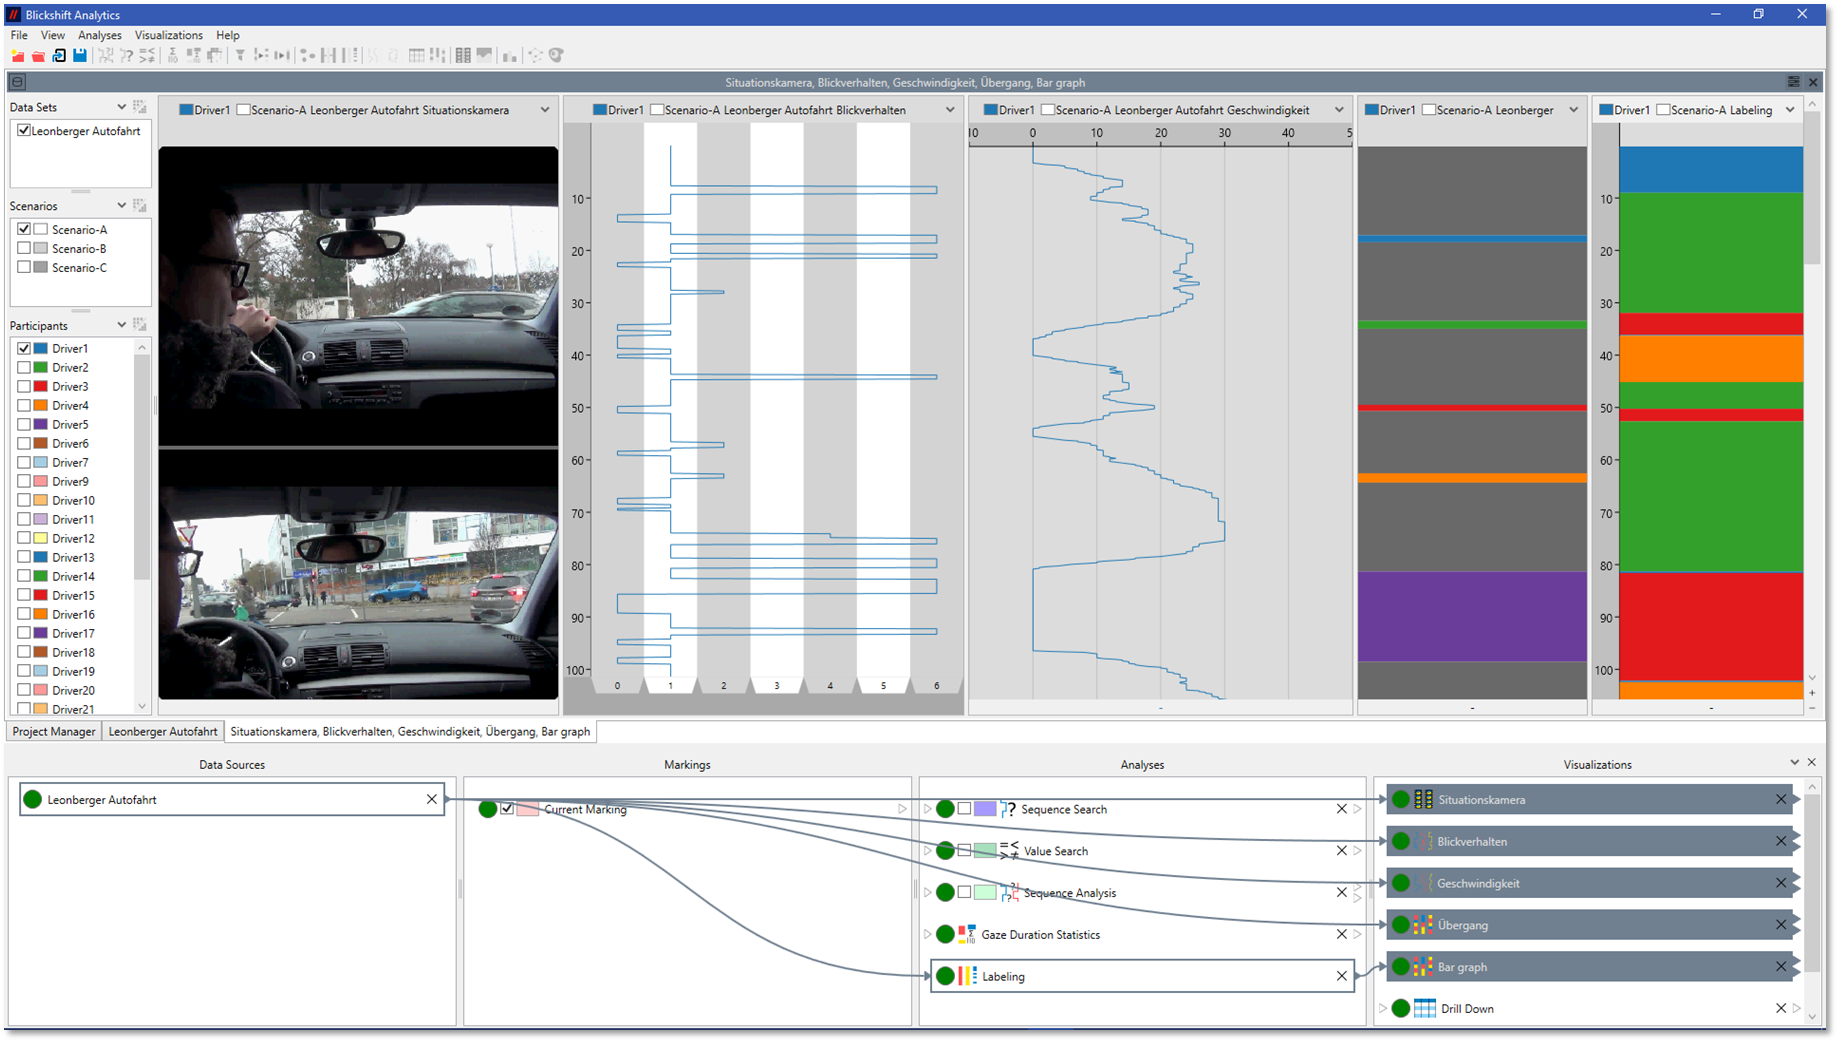
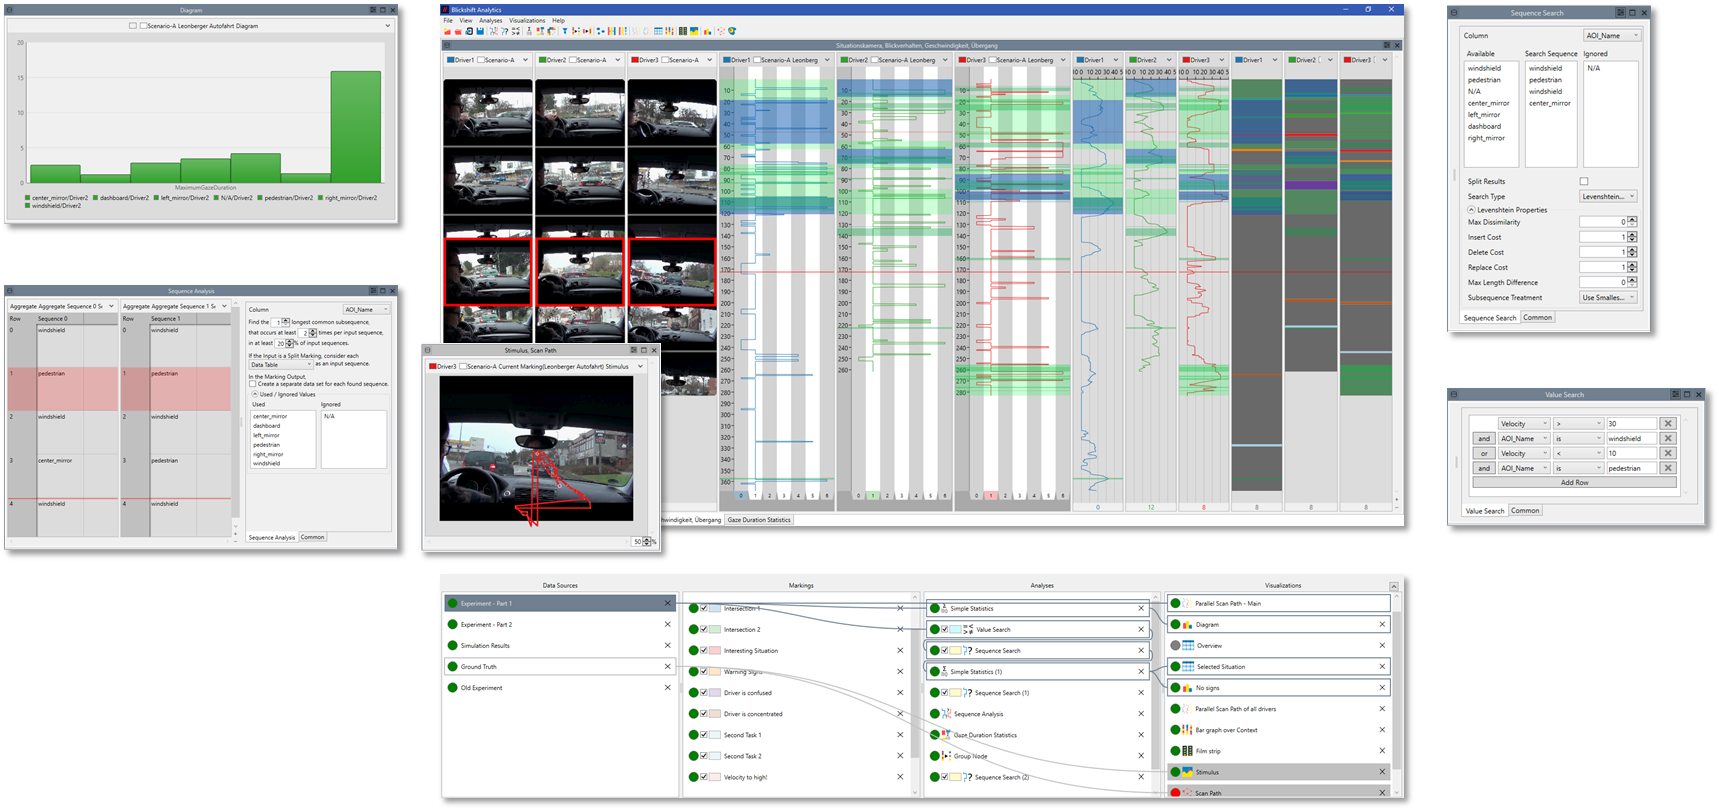
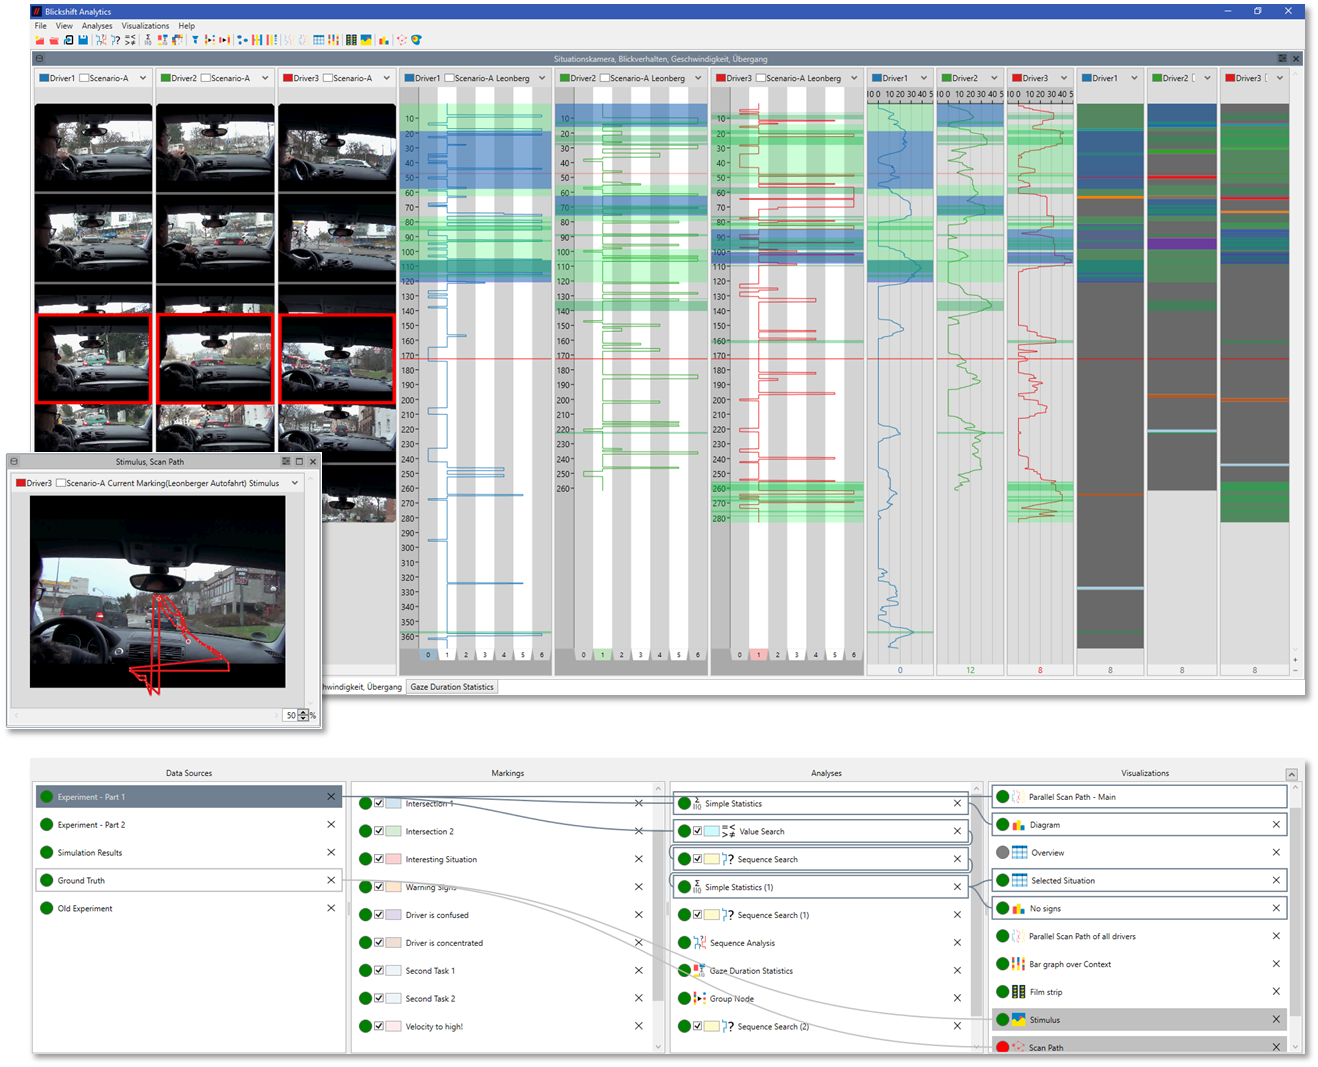
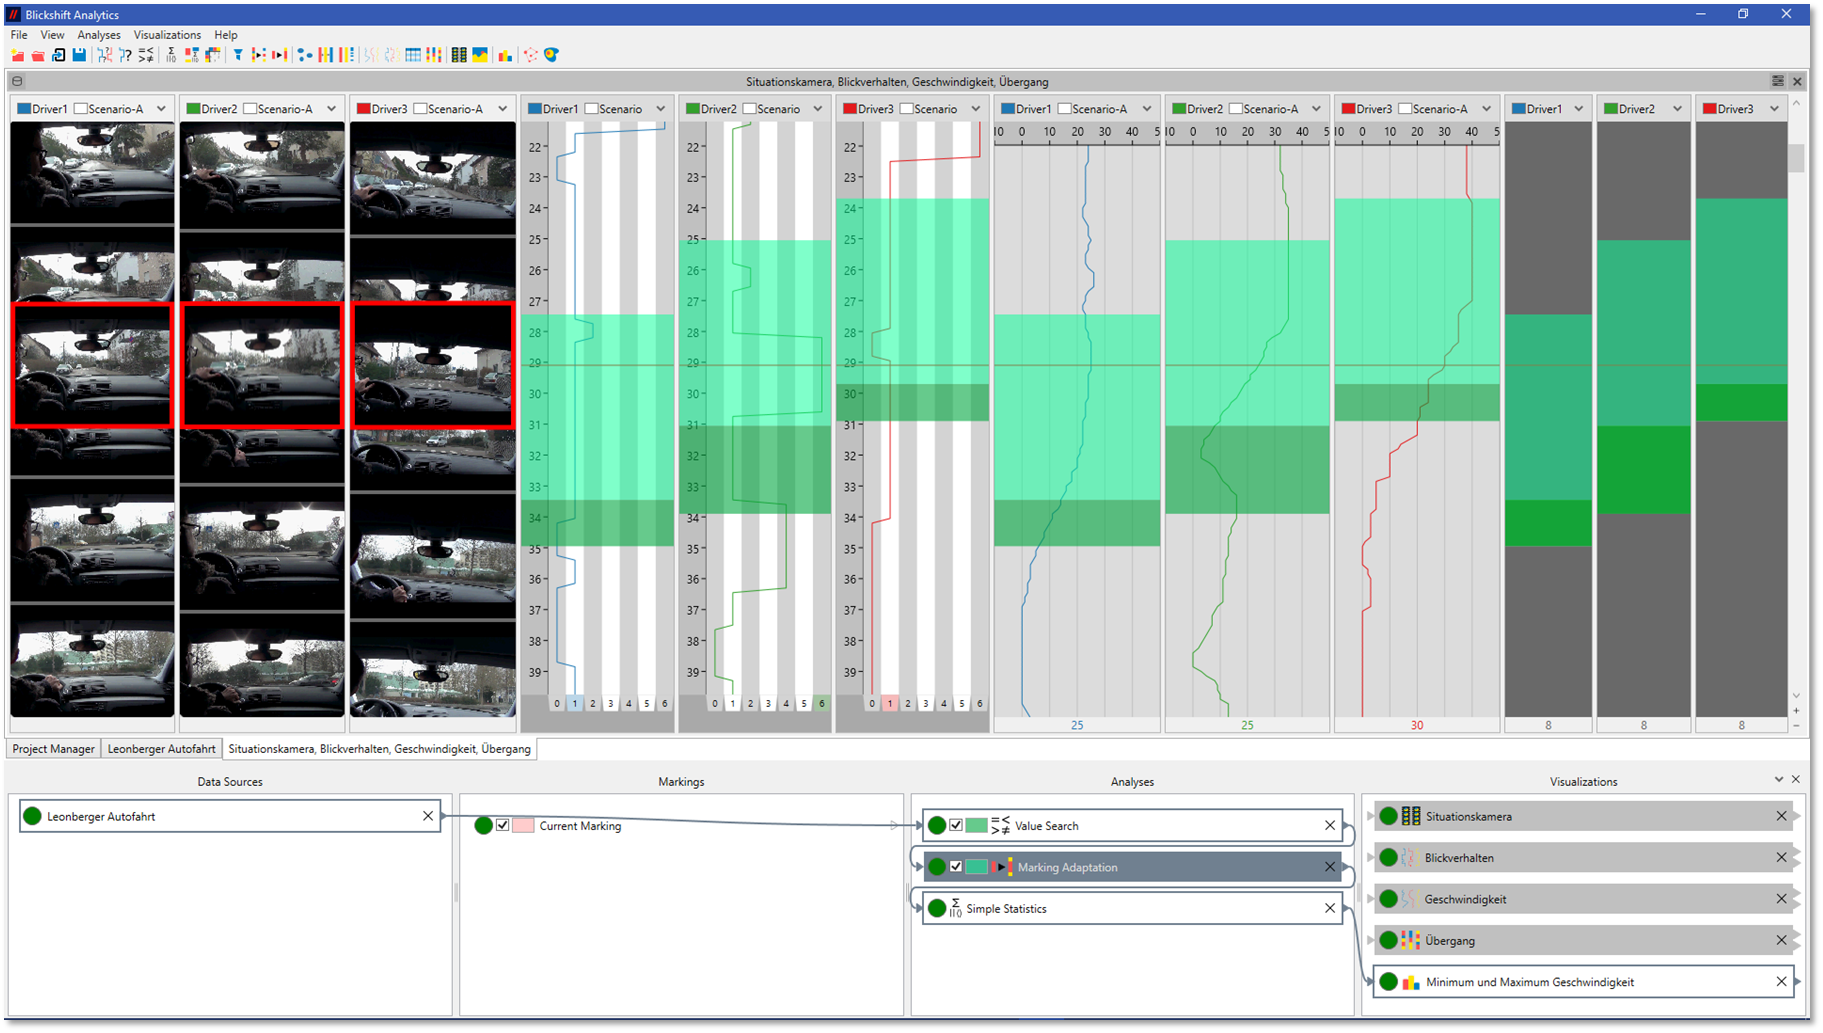
One of the great challenges in analyzing driver experiments is the data complexity. Besides eye movements, there is a lot of other sensor data from the car like steering wheel angles, pedal activities and information from distance sensors and object recognition systems. Additionally, there are log files about the interaction between drivers and the interieur and context information about the traffic situation.
With our solution Blickshift Analytics you can analyze this data with an previously unknown efficiency. You get an efficient overview about your data, you can find quickly relevant time sections and identify participants with a similiar eye movement and driving behaviour. Analysis tasks, which required a time effort of days or weeks in the past, can now be done within a few hours!
Most times, second tasks are performed in driving experiments by the participants. A common analysis task is to identifiy common eye movment behaviors before an “event” during the second task. Or, a complete task block has to be analyzed in a high level of detail and has to be compared with other task blocks in the experiment.
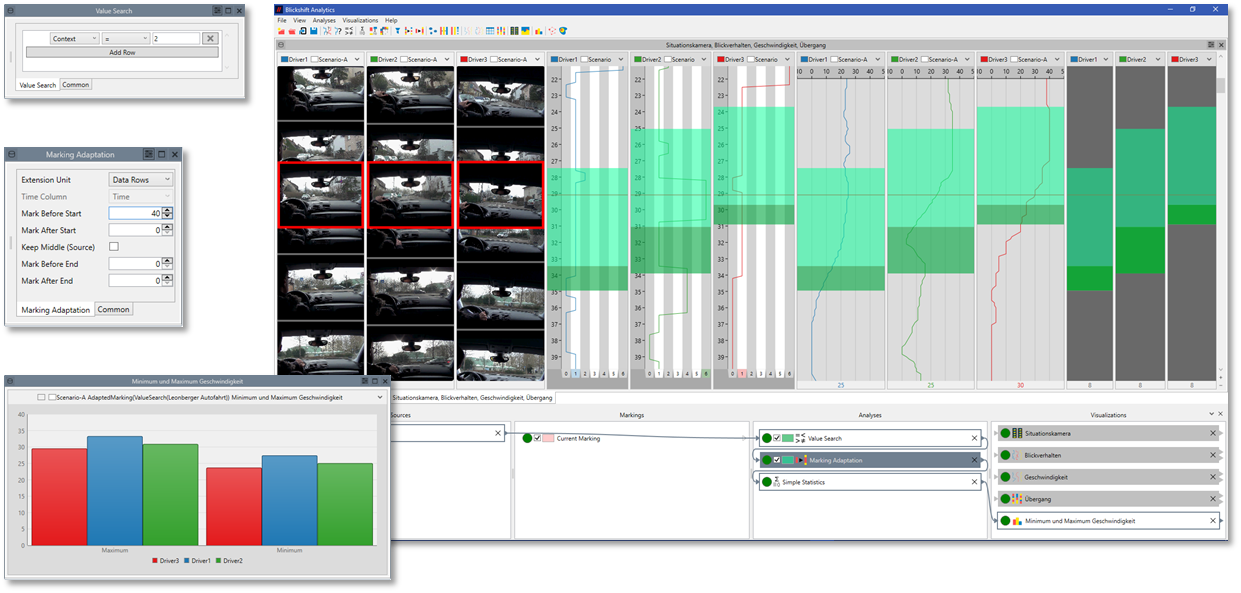
With markings, an interactive section of data, you can analyze your data with respect to different conditions. For example, you can concentrate your analysis on the eye movement behavior before the drivers pass a crossing, which is labeled in the data. Interactively, you can test different time duration for marking the data. With automatic components you quickly compare the eye movements over many participants.
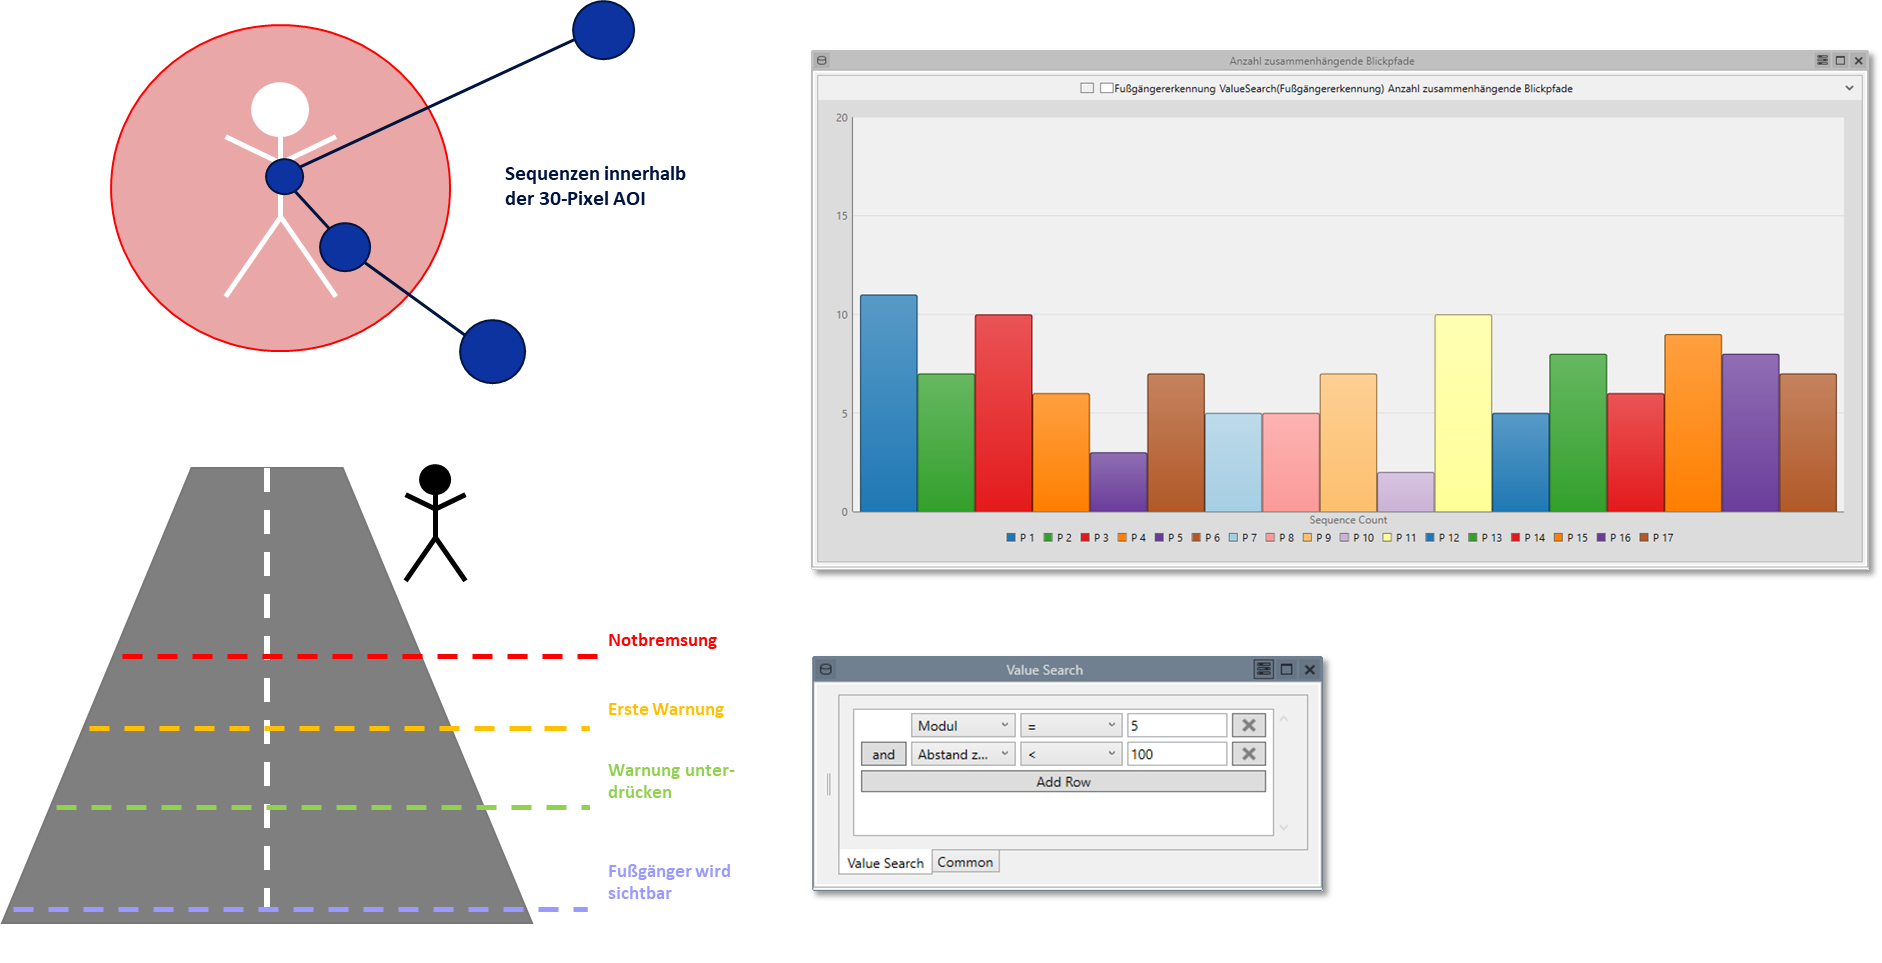
Driver models are the basis for advanced driver assistance systems (ADAS). A critical step during the development of driver models is to find optimal model parameters. For example, several fixations are required to perceive a pedestrian with a high probability. The exact number of fixations or an interval for the number of fixations is specified by driving experiments.
For the parametrization of driver models, you can use a combination of different visualizations and automatic components in Blickshift Analytics. However, the workflow is very simple: you only have to connect the necessary visualizations with the automatic components in Blickshift Analytics. Next, you interactively test the model parameters. Results are immediately shown in the visualizations.
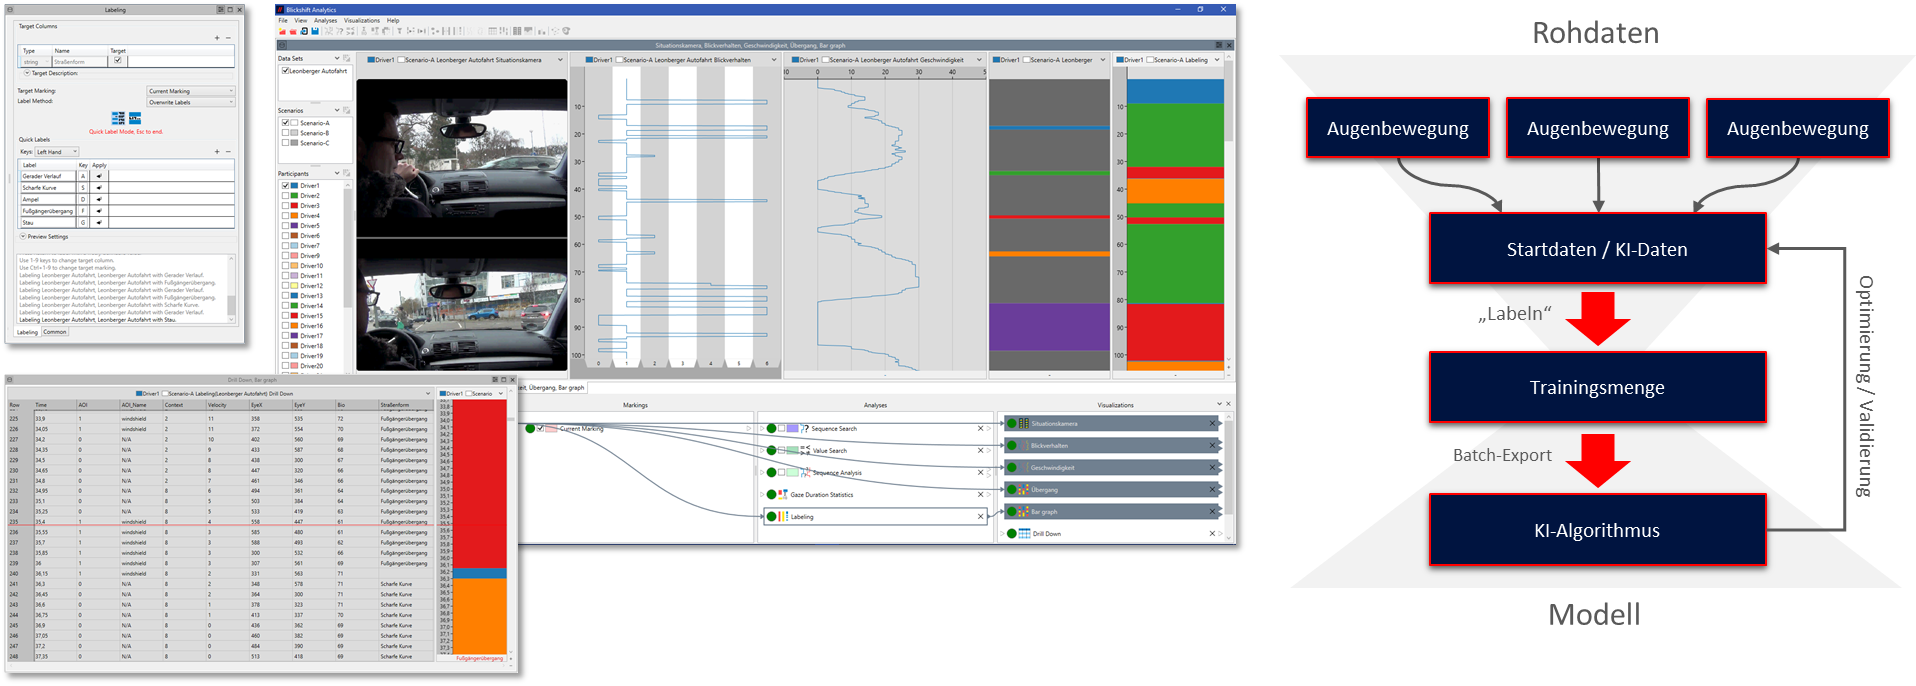
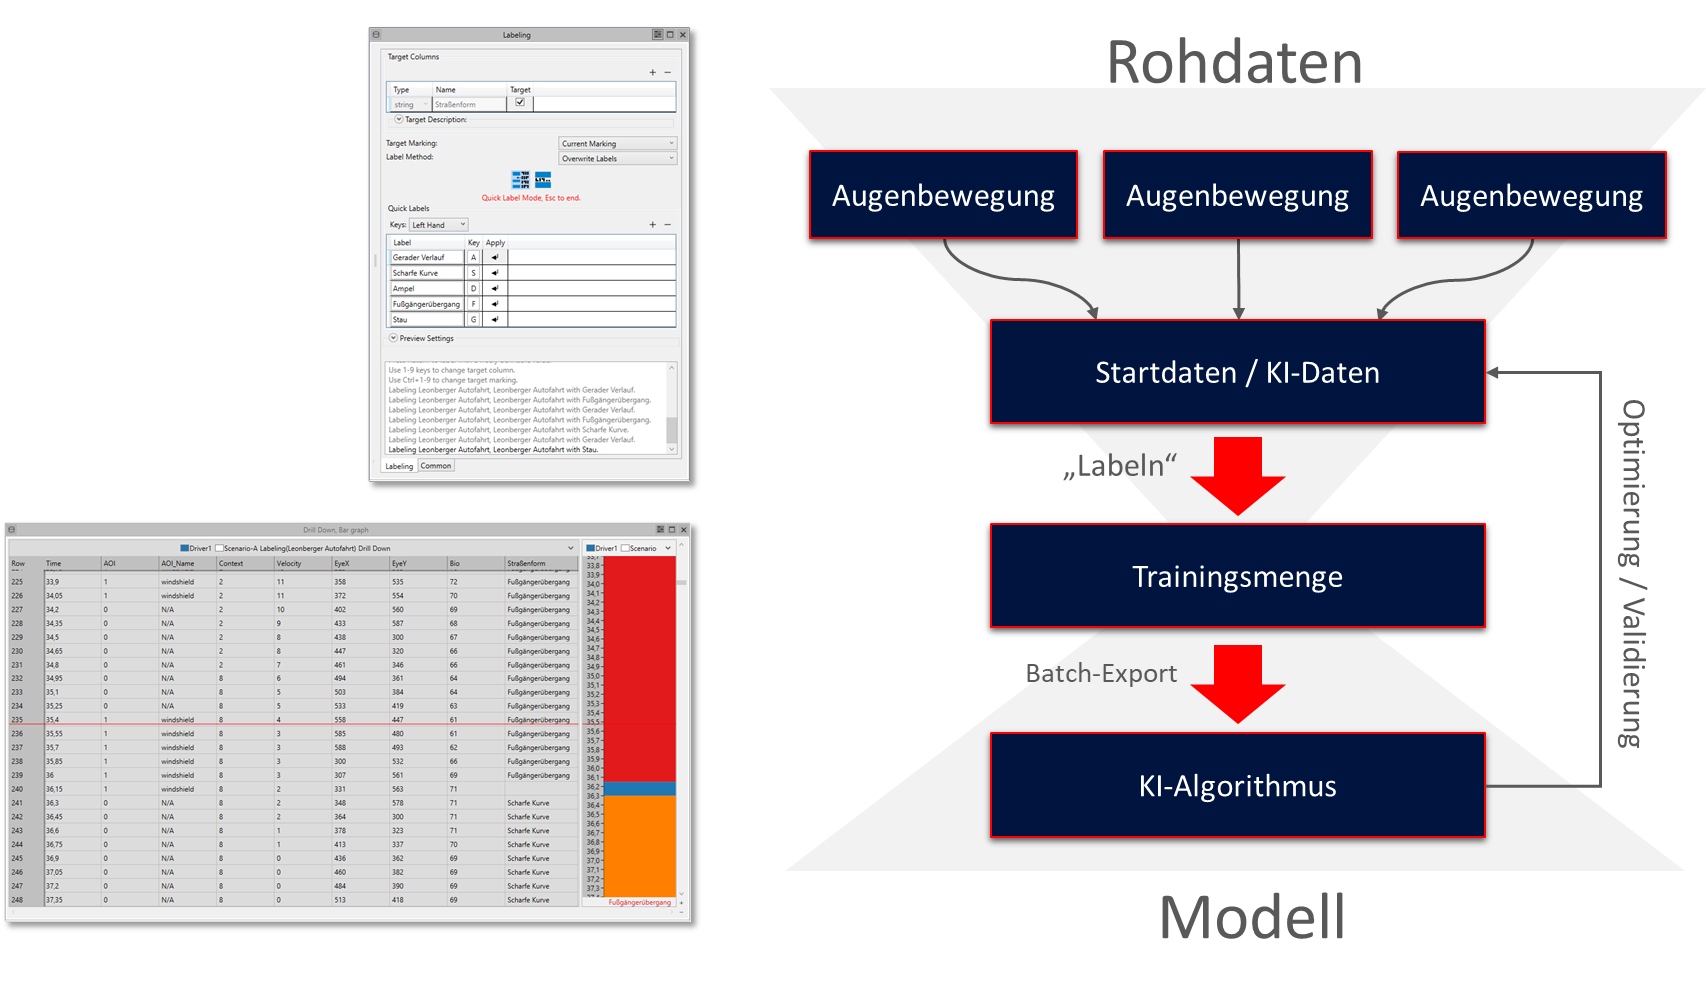
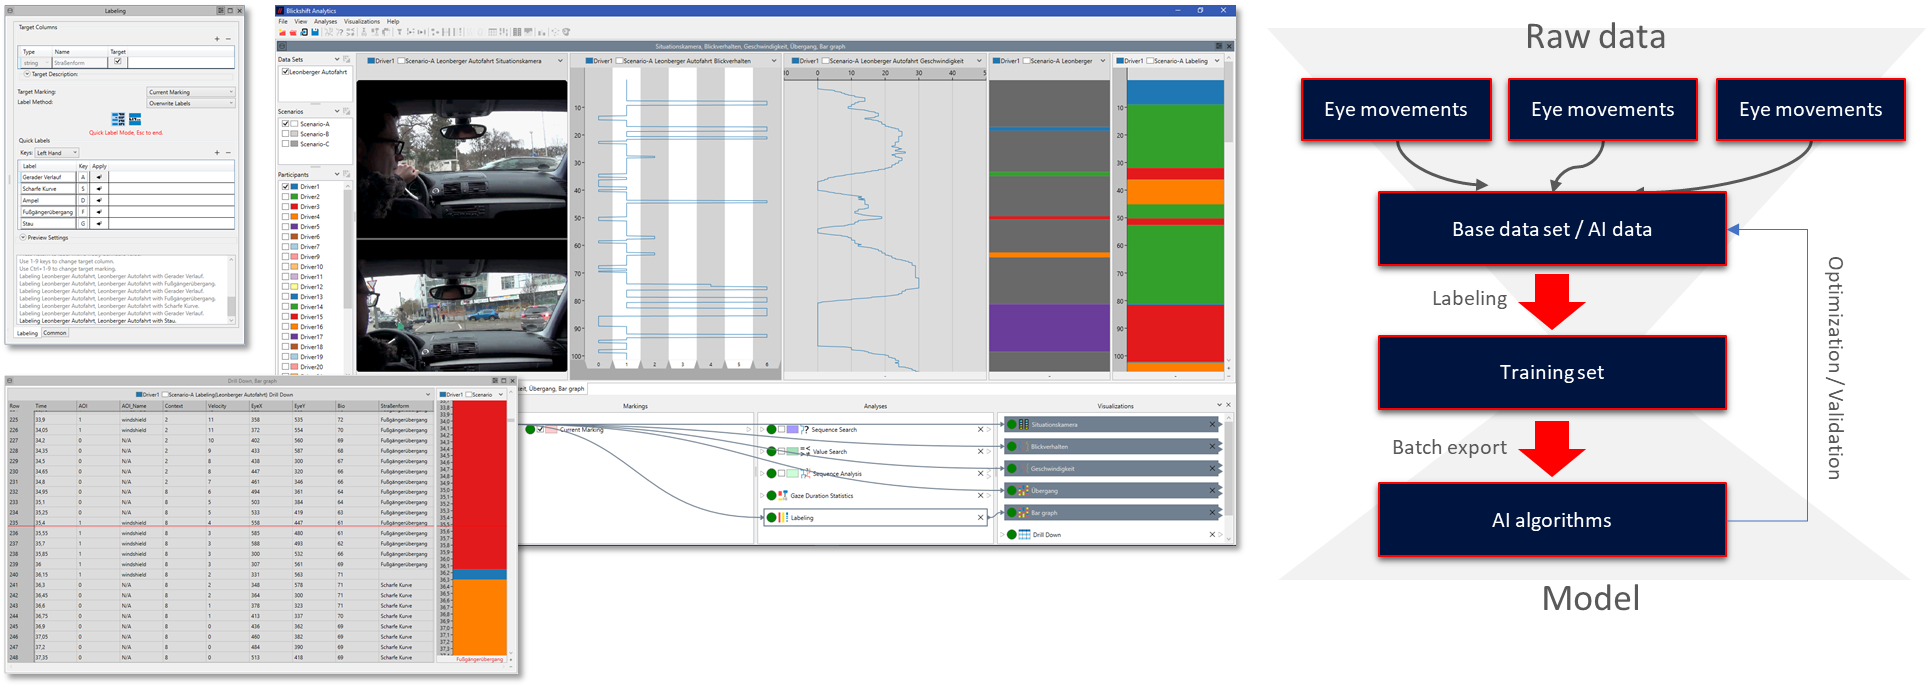
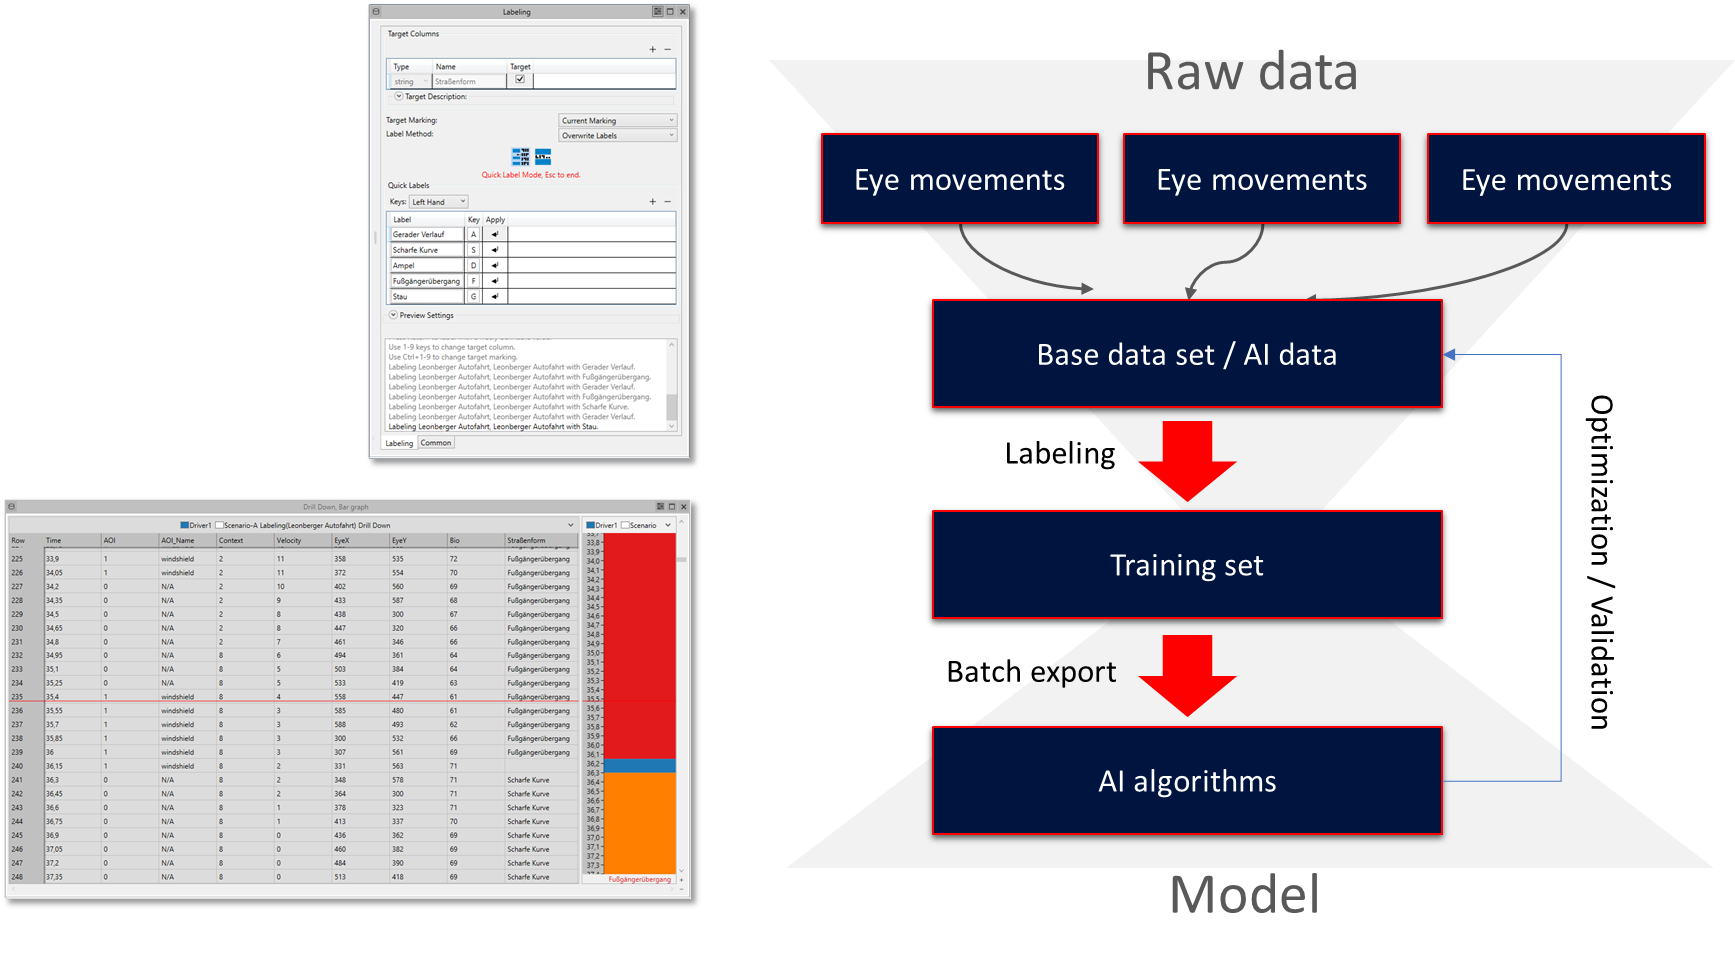
A high number of AI algorithms are trained based on manual or semi-automatic generated training sets. In contrast to generating training sets based on images, the generation of training sets based on time dependent data is more complex. Since eye movements and sensor data belong to the class of time dependent data sets and state of the art tools were missing so far, generating training set for this kind of data required a high effort for a self-development.
For generating training sets Blickshift Analytics offers one of the most efficient solutions on the market. Again, the workflow is very simple: First, you select sections in the data and annotate these sections with labels. Second, you export these sections together with the assigned sensor and eye tracking data. Finally, you use this exported data as training sets. For generating training sets, you can choose out of two modi: You can manually select your data or you can use the support of Blickshift’s automatic components.
Additional solutions (selection)
Large and complex data
- Highest efficiency for analyzing large eye tracking data
- Analysis of eye tracking experiments with hundreds of participants
- Analysis of long term experiments with eye tracking
Data management
- Sensorfusion with geo location data of participants (via GPS or others)
- Integration of thinking aloud protocols
- Pleasant graphics for your paper directly from the analysis
Use annotations in eye tracking data
- Event-based eye tracking analysis
- Automatic, scene-based analysis
- AOI editor reworked
- Definition of general workflows
Methods (selection)
- Finding of recursions during text reading
- Identification of spatial deviations from the optimal viewing positions during text reading
- Identification of spatial deviations from geodesic scan paths
- Efficient finding of fixation loops
- Analysis of visual search strategies
- Direct, visual analysis of cognitive processes during reasoning
- Definition of ideal scan paths
- Development of further algorithms for similarity detection of scan paths
- Identification of correlations between mouse interactions and eye movements
- Analysis of visual perception of videos
- Analysis of visual perception of interactive, graphical interfaces
- Manual labeling of existing data streams
- Semi-automatic labeling of existing data streams
- Training of AI algorithms
- Analysis of three-dimensional perception
- Combined analysis of visual perception and mental activity (e.g. with EEG or fMRT data)
- Combined application of Blickshift Analytics and cognition simulations (e.g. ACR-R or Soar)
- Parameters identification for memory models
- Study of visual knowledge processes
- Comparison of different eye tracking systems
- Optimization of study design in eye tracking experiments
Dynamic and interactive stimuli
- Analysis of head-mounted user studies
- Analysis of video stimuli
- Gaze replay function
- Analysis of interactive stimuli
Iterative development of research questions
- Explorative development of hypotheses
- Efficient creation of intermediate data during performing eye tracking experiments
Perception experiments
- Identification of differences in eye movements of children, teenager, adults and elderly people
- Driving perception analysis
- Visual perception and cognitive processing of mathematical equations
- Analysis of eye movements in zero gravity
- Reading of music note sheets
- Analysis and optimization of teaching concepts and student-teacher interaction
- Study of visual perception of public displays
- Analysis of socio-cognitive processes
Human-computer interaction
- Detailed analysis of human-computer interaction
- Analysis of interaction between users
- Detailed analysis of human-machine interaction
- Optimization of touch screens
- Ergonomics tests of graphical interfaces
- Training of assistants for human-machine interaction
- Visual perception of ubiquitous computer environments
Support for AI development
- Optimization of AI algorithms based on visual perception
Virtual Reality and Space Research
- Virtual Reality (visual perception and motion sickness)
- Analysis of vestibular user experiments
Cognitive and Perceptual Sciences
- Cognitive load during visual tasks
- Cognitive bias analysis
- Evaluation of eye mind hypothesis
- Parametrization of models for computing physical parameters of eye movement
- Development of prediction models for reading behavior
- Parametrization of spreading activation models
Visualization Research
- Development of operator-based reading models for visualizations (like KLM)
- Development of reading rules for visualizations
- Efficient, iterative development of visualization concepts
- Evaluation and optimization of visual analytics methods
- Evaluation and optimization of visualization techniques
- Support for developing ergonomic benchmarks for visualizations
Blickshift Engineering and services
Blickshift Engineering and services
- Partnership in research projects
- Associated partnership in research projects
- Consulting services for writing proposals
- Reviewer for world-wide known conferences (e.g. Eye-Tracking Research and Application Symposium)
- Integration of Blickshift Analytics in an existing software environment
- Adaptation of existing software for optimal data exchange with Blickshift Analytics
- Design and implementation of components based on the Blickshift framework for the analysis of customer-specific questions
- Design and implementation of perception models
- Parametrization of perception models by Blickshift
- Development of customer-specific software solutions for driver observation
- Consulting services for designing and performing user experiments
- Analysis of existing data sets in user experiments with Blickshift Analytics
- Eye tracking Workshops

