Concepts
Table of Contents
This chapter defines and explains some terms that are used throughout this documentation. It is not necessary to read through the entire chapter. Instead, when one of the terms is used, a link back to the fitting section of this chapter is given, allowing you to quickly look up the meaning.
In this chapter, we assume that you are analyzing data from a classic user study, with participants and tasks (or scenarios) that the participants performed. This assumption is mainly used to make the nomenclature easier to understand. If the data you want to analyze is structured differently, you can try to map your data onto the nomenclature used here.
Data
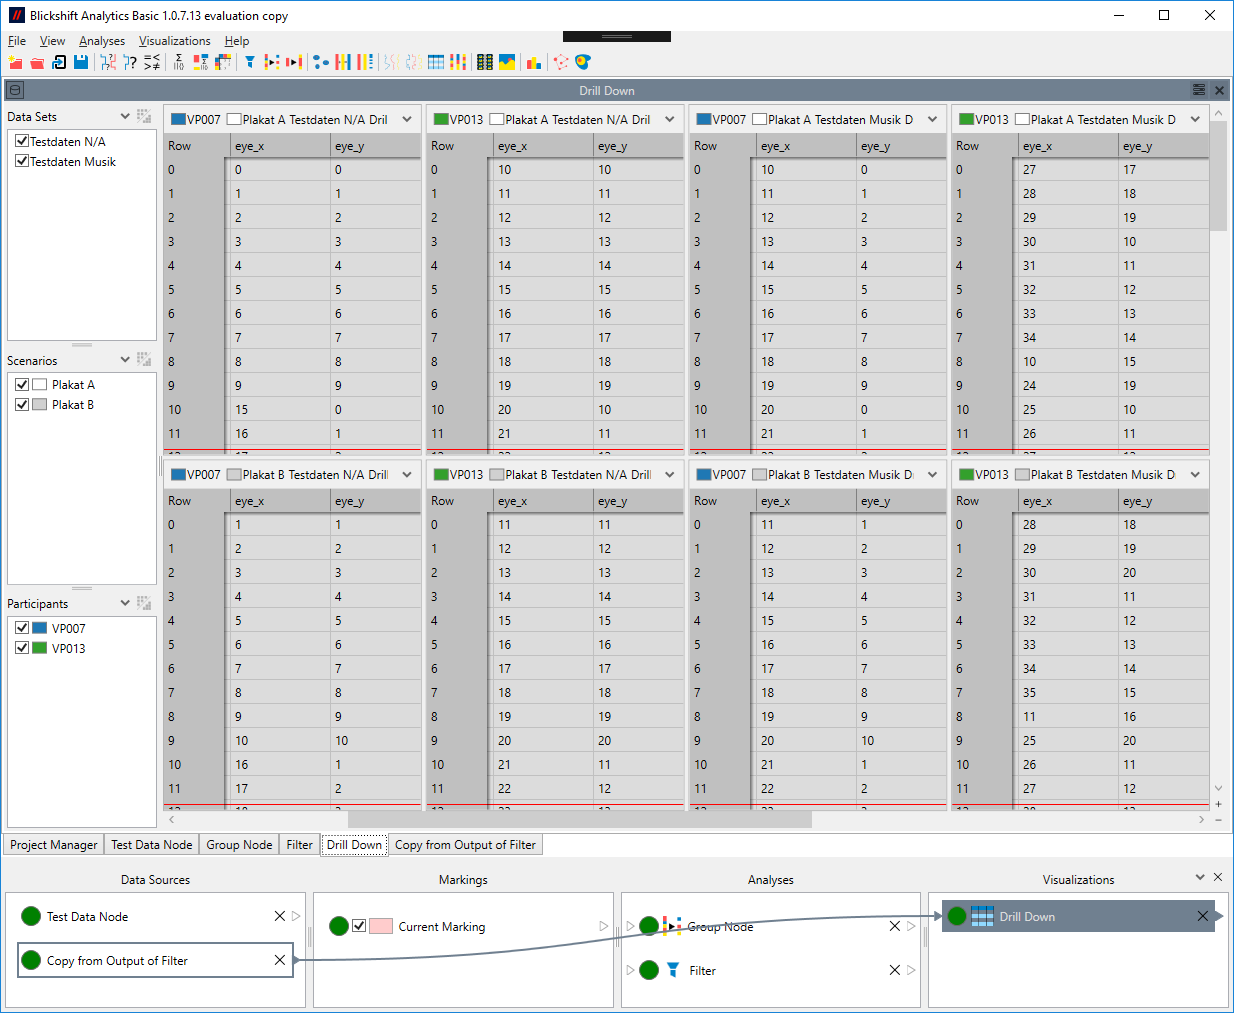
In order to fully understand all the possibilities of analyzing data with Blickshift Analytics, it is helpful to understand how the data is structured. Figure 1 shows how data sets, scenarios, participants and data columns relate to each other.
Data Set
A data set is the topmost data structure in Blickshift Analytics. A data set contains a number of data tables, all with the same data columns. In many cases, you will only ever have one source data set for your project. Other data sets may be produced by analyses. Most analyses produce one output data set per input data set. Some analyses, such as the Group Node, produce many output data sets, which gives you the opportunity to organize your data according to specific criteria.
Data Table
A data table is a unit of data, with many data columns. In each data set, there is (at most) one data table per scenario/participant combination, which contains the data pertaining to one particular participant in one particular scenario.
Scenario
A scenario is a specific task or other unit that was performed by your participants. In a classic eye tracking study for advertisements, each different advertisement would be one scenario.
Data Column
A data column is all the data in one data table that belongs to the same data dimension, e.g. one coordinate of your eye tracking data, the speed of a test vehicle, the temperature, etc. Most analyses and visualization operate on only one or two data columns, and you have to select the data column that you want to get a result for.
Enumerable Column
Enumerable Columns are data columns that contain only a low number of distinct data points, as opposed to data columns that contain continuous data, like e.g. the vehicle speed. The prime example of enumerable columns are AOIs. Some analyses and visualizations only work on enumerable columns.
Data Node
A data node is a node that hosts data and is used as a source for analyses and visualizations. Its window shows a preview of the data, if possible, and its Settings pane allows to set some metadata for the data columns. The importer tries to guess these metadata, but with the variety of data formats, those guesses are not always correct. Setting up the metadata correctly helps analyses and visualizations to often correctly guess the required columns for specific purposes.
Settings
- Eye X Coordinates:
- The raw eye coordinates (x direction). The selected column will be used by default by the Fixation Computation.
- Eye Y Coordinates:
- The raw eye coordinates (y direction). The selected column will be used by default by the Fixation Computation.
- Fixation X Coordinates:
- The fixation coordinates (x direction). The selected column will be used by e.g. the Scan Path and the Heat Map.
- Fixation Y Coordinates:
- The fixation coordinates (y direction). The selected column will be used by e.g. the Scan Path and the Heat Map.
- Fixation Duration:
- The duration column of the fixations. If your fixation computation algorithm has computed durations for each fixation, select this column here. It can then be used in the Scan Path.
- Time:
- The main time column. This will be used by nodes that compute values based on time, such as the gaze durations statistics. It is also used as the default time axis in time-based visualizations. You can only select columns with monotonically increasing values here, as others would result in incorrect results for the computations.
- Video Time:
- The video time column. The selected column is used by default by the film strip and stimulus visualization.
- AOI:
- The AOI column. The selected column is used by default by the Parallel Scan Path, the Gaze Duration Statistics, the Transition Matrix, the Sequence Search, and the Sequence Analysis.
- Stimulus Name:
- If you have data, that associates different stimuli within the same data table (i.e. scenario/participant combination) and a column that contains stimulus names, you can select this column here. This column will then be the default stimulus column, if you set stimulus selection of the stimulus visualization to "Column".
Markings
A marking is a reference to a specific subset of the data that exists anywhere in the current project. In the simplest case, a marking references a subset of the base data that you want to analyze.
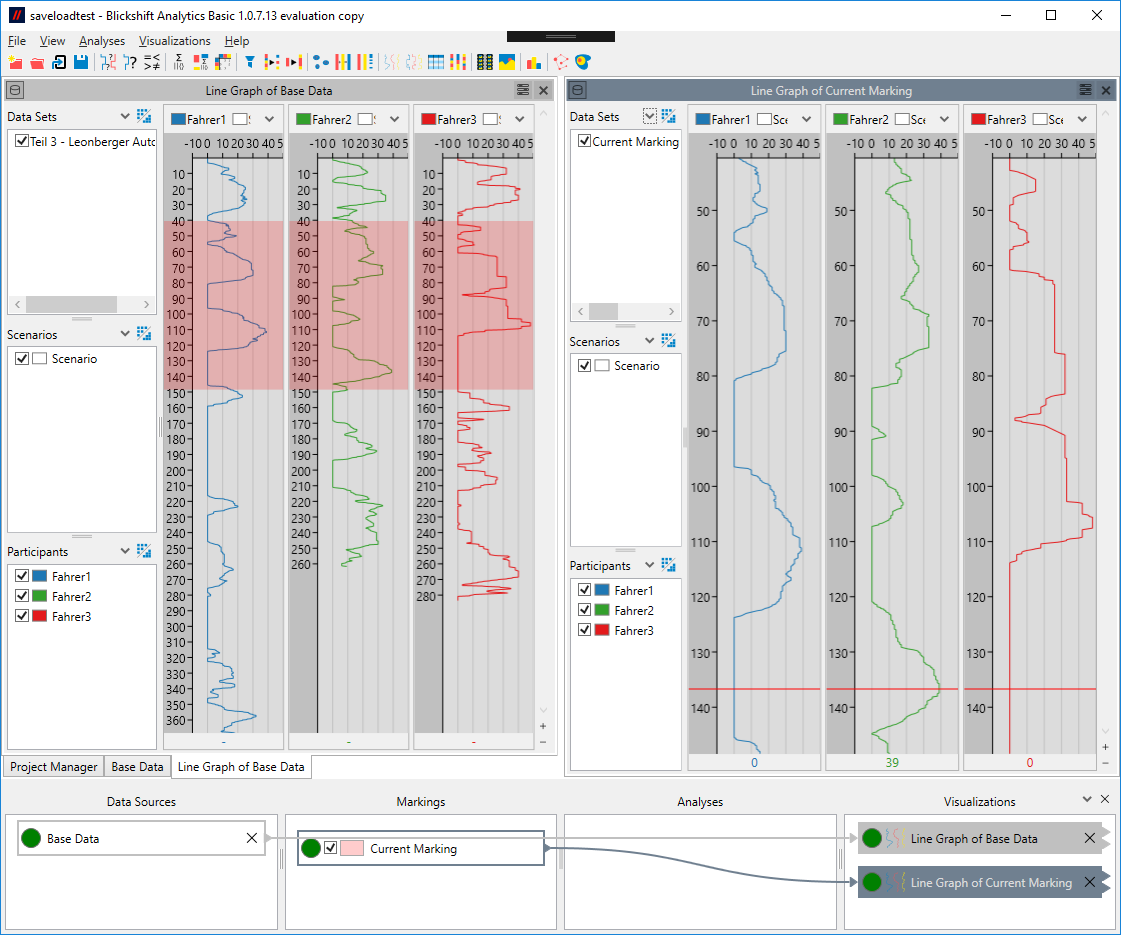
Figure 2: A marking displayed on a line graph, and the same marking visualized by another line graph.
The marking itself behaves just like any other data set. This means that you can use a marking as an input for visualizations and analyses, just like you can do with any other data. If you use a marking, only the subset that is referenced by the marking will be visualized and analyzed. Figure 2 shows a marking on the base data set that is displayed on a line graph, and the same marking visualized by another line graph.
Markings currently have three different sources:
- Current Marking:
- The current marking can be manipulated by the user, normally via the mouse cursor in time-based visualizations.
- Analysis Result Markings:
- The marking is the result of an analysis, e.g. a Value Search or a Sequence Search. The marking references those parts of the data that fulfill the criteria of the analysis.
- Stored Markings:
- As the current marking and analysis result markings can change rapidly, you can make any marking permanent by duplicating it. Once a marking has been duplicated (stored) it will no longer change, even if the original marking is changed or deleted.
Split Marking
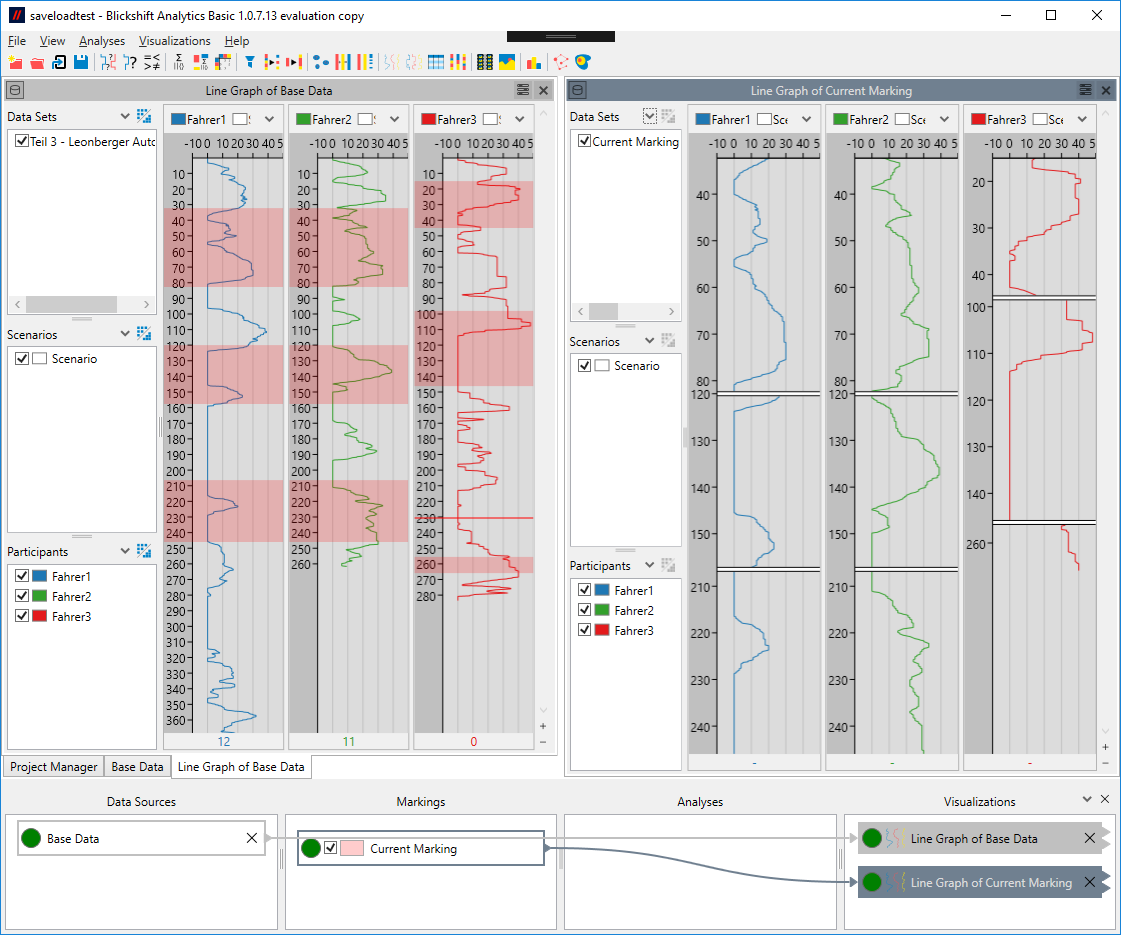
A split marking is a marking that references data that is not continuous. Figure 3 shows a split marking, in contrast to the continuous marking in figure 2. The line graph that visualizes the split marking displays split markers that indicate the discontinuities in its data.
Split markings can be used just as any other marking, but there are some analysis options that do not work (or only work) with split markings. The documentation of the analyses mentions whenever such cases exist.
Analyses
An analysis is a component that receives input data, performs a computation (often influenced by parameters) and creates output data. Most analyses do not have their own visual representation of the data. Some analyses offer a preview of the result similar to a Drill Down visualization. Some analyses that output markings (e.g. Value Search and Sequence Search) do not offer previews for the data. Instead they can be added to the same window as a visualization of their base data, where the result marking will be highlighted.
Visualizations
Visualizations are components that receive input data and display the data in a visual manner. Visualizations do not normally output any data.
Time-based visualizations are visualizations that display time along one axis. For more information, see time-based visualizations.


