Parallel Scan Path
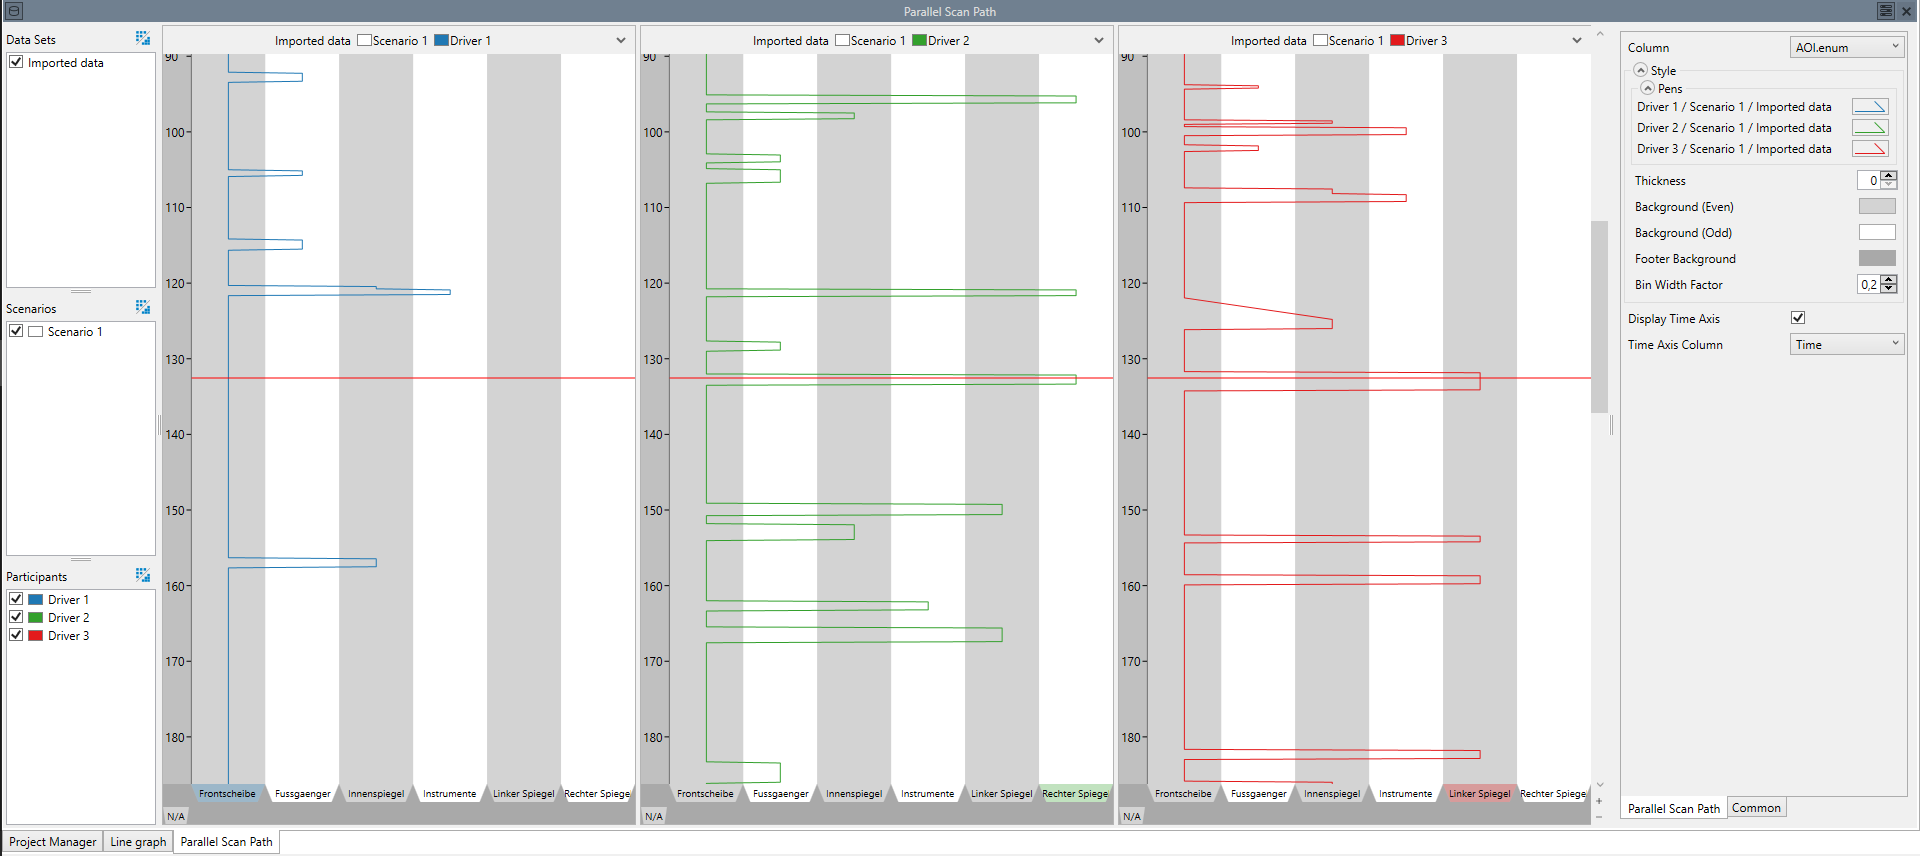
The parallel scan path (PSP) displays the progression of AOIs (or similar values) through time. Figure 1 shows a parallel scan path.
The parallel scan path visualization allows some user interaction: The AOIs can be sorted by dragging and dropping the tabs displaying their names. Additionally, a right-click on a tab opens a context menu that allows ignoring the AOI (similarly, an ignored AOI can be re-enabled). Ignoring an AOI will result in slanted connections, if the ignored AOI was between two different AOIs. However, if an ignored AOI existed between a single AOI, the result is a straight line, as if this single AOI was never interruped (by the ignored AOI). This behavior is intentional, and can be used when the Eye-Tracking data had intermittent failures (e.g. by the participant blinking) that were recorded as a distinct AOI. However, if used with real AOIs, ignoring can lead to misleading visualizations and thus should be used cautiously.
Aggregation
Aggregating a Parallel Scan Path displays all PSPs of all participants and/or scenarios / data sets in the same window. Note that the display of aggregated PSPs can be tuned with the parameter Bin Width Factor.
Settings
- Style:
- Parameters that determine the look of the visualization:
- Pens:
- The styles used to draw the parallel scan paths.
- Thickness:
- The thickness of the lines that are drawn. If the value is 0, the thickness of each line can be set individually in the pen dialog of each line. Otherwise this value overrides the individual values and can be used to quickly change all lines.
- Background (Even):
- One of the two colors used for the background.
- Background (Odd):
- The other of the two colors used for the background.
- Footer Background:
- The color for the background of the footer.
- Bin Width Factor:
- The bin width used when aggregating several parallel scan paths. If this value is 0, the aggregated scan paths are drawn on top of each other. If it is 1, the entire width of the column is used to draw scan paths.
- Display Time Axis:
- Determines, whether the time axis is displayed.
- Time Axis Column:
- The column used for the labels of the time axis.
- Used / Ignored Values:
Determines the values to be ignored in the visualization as well as the sequence of the used values. Use drag & drop to change.
If ignored values exist between two other distinct values, in place of the ignored value a slanted line is displayed in the visualization. If an ignored line exists between values that are equal, this value is used and a straight line is shown, as if the ignored value didn't exist at all. This is intentional, as it allows filtering out unwanted noise, but should be used sparsely, as it can result in parallel scan paths that have nothing in common with the base data, if used excessively.
